Top batsmen in cricket
In a previous post, I used data from Statsguru and looked at a brief history of cricket with respect to debut years and career spans of players. In this post, I use detailed player statistics from the same dataset to select top batsmen who have played this game.
Distribution of matches played by all players
Let’s take a look at the summary statistics of number of matches played by all players in each format of the game.
Number of matches played by all players in each format
Format: Tests
   Min. 1st Qu.  Median    Mean 3rd Qu.    Max.
   1.00    2.00    7.00   17.27   21.00  200.00
---------------------------------------------------------------------------
Format: ODIs
   Min. 1st Qu.  Median    Mean 3rd Qu.    Max.
   1.00    4.00   16.00   42.56   53.00  463.00
---------------------------------------------------------------------------
Format: T20Is
   Min. 1st Qu.  Median    Mean 3rd Qu.    Max.
1.0 2.0 7.0 13.9 18.5 98.0 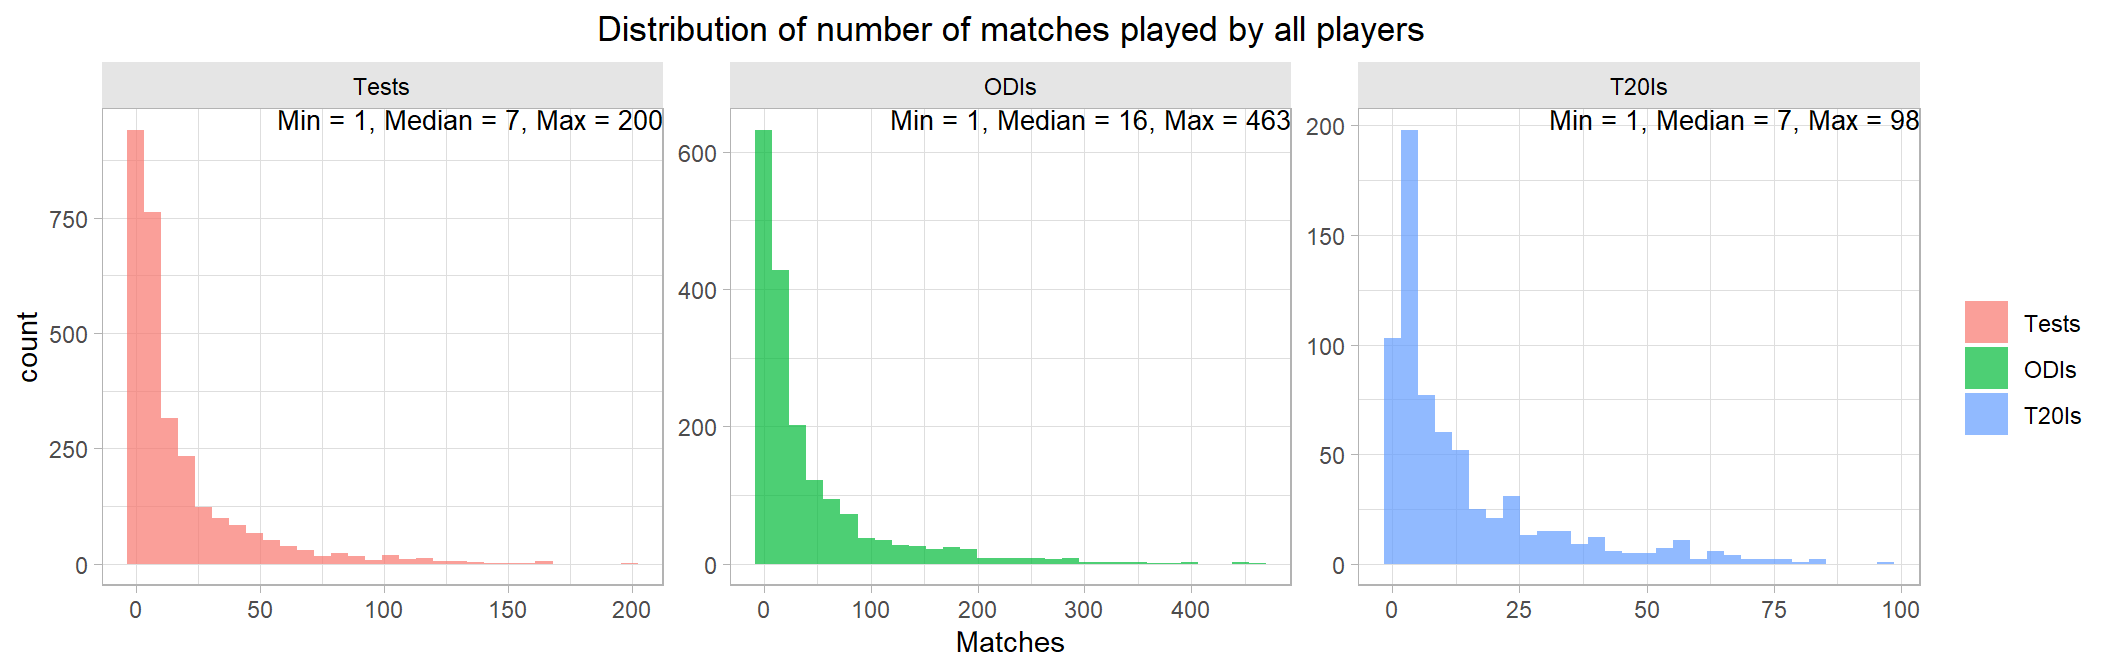
The distribution appears to be heavily skewed towards the right. In simple terms, there are a handful of players who go on to play 100+ Tests and 200+ ODIs. A majority of the players have played very few matches. The mean and median are hardly indicative of players who established themselves in their teams.
Distribution of innings to matches played by all players
A cricket team has 11 players, out of which 5 or 6 are specialist batsmen, 1 or 2 are all-rounders (could bat and bowl well) and the rest are specialist bowlers. The wicketkeeper also has to be a good batsman. The batsmen play up in the order in a match and get to bat before the bowlers do.
Here I will introduce another measure to distinguish batsmen from bowlers - ratio of innings played relative to number of matches played. In many matches a bowler doesn’t get a chance to bat, unless the top order batsmen and all-rounders fail, i.e. are out. Hence the ratio of innings to matches of specialist bowlers will be low.
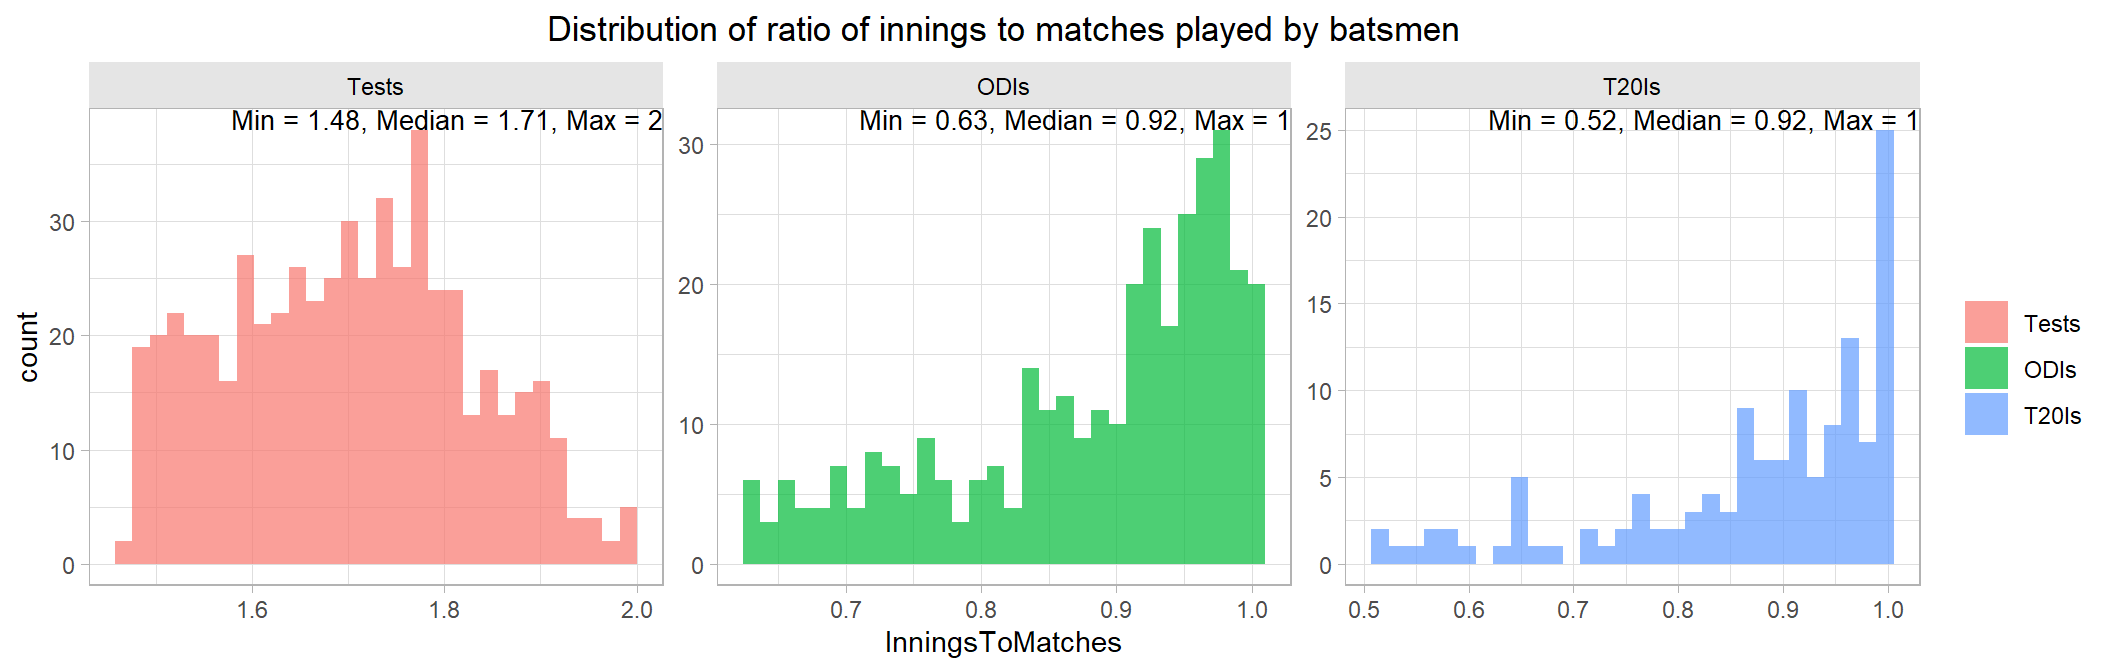
Here are the summary statistics of this ratio. The ratio is greater than 1 in Tests because each player could play upto 2 innings. The peaks in each plot are indicative of batsmen who have batted in the top 3 and have gotten a chance to bat in nearly every innings of every match they played.
Ratio of innings to matches of all players in each format
Format: Tests
   Min. 1st Qu.  Median    Mean 3rd Qu.    Max.    NA's
  0.250   1.429   1.667   1.623   1.923   2.000      19
---------------------------------------------------------------------------
Format: ODIs
   Min. 1st Qu.  Median    Mean 3rd Qu.    Max.    NA's
 0.1250  0.5714  0.8421  0.7670  1.0000  1.0000      62
---------------------------------------------------------------------------
Format: T20Is
   Min. 1st Qu.  Median    Mean 3rd Qu.    Max.    NA's
0.05556 0.50000 0.85714 0.73084 1.00000 1.00000 73 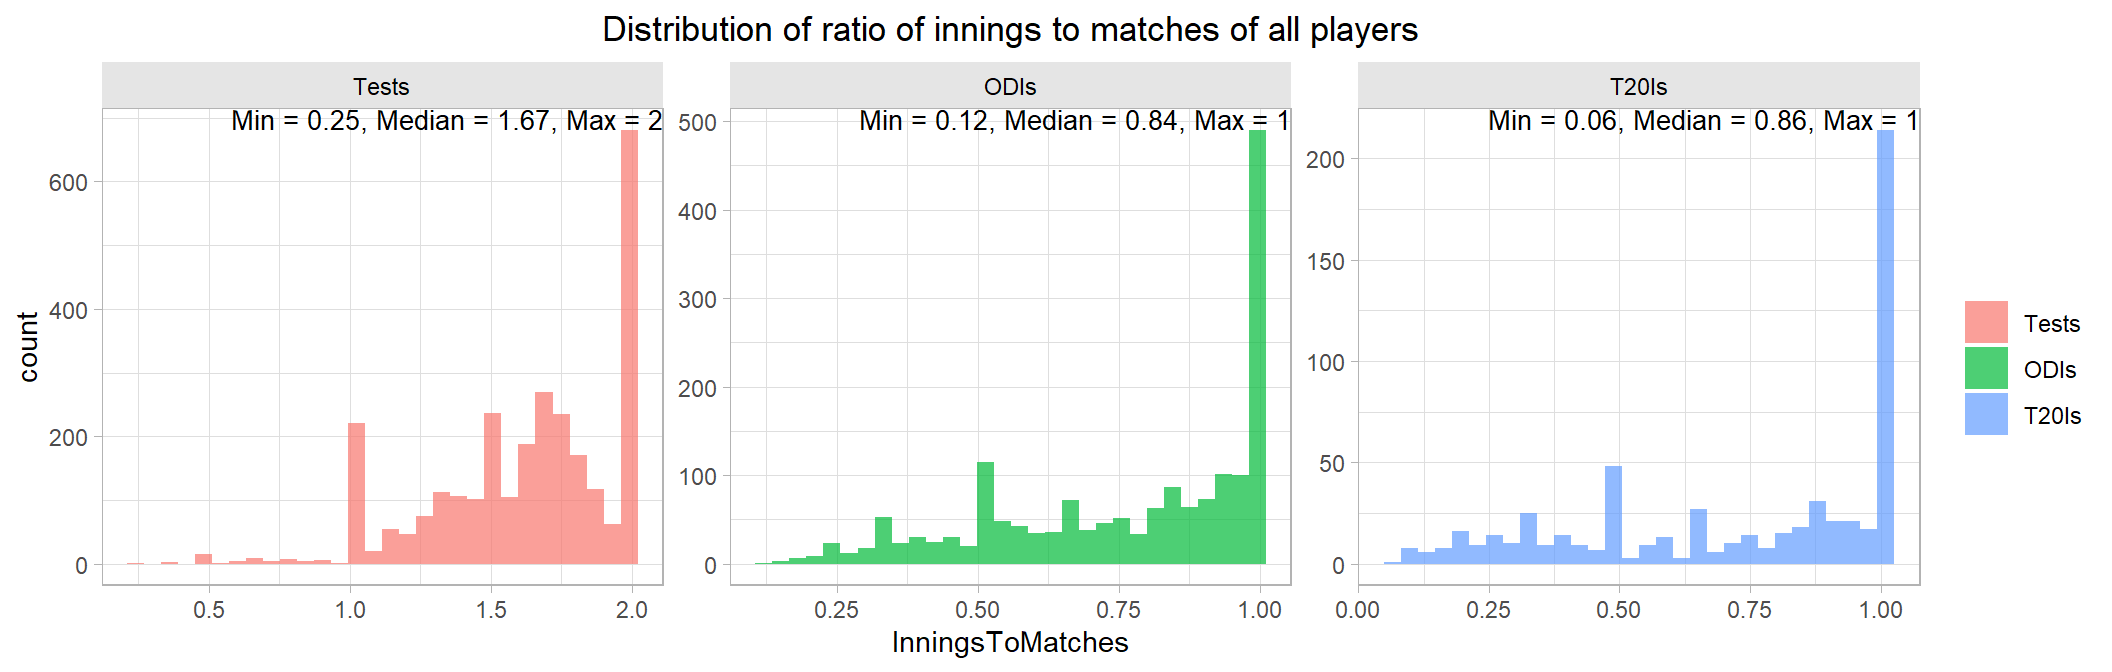
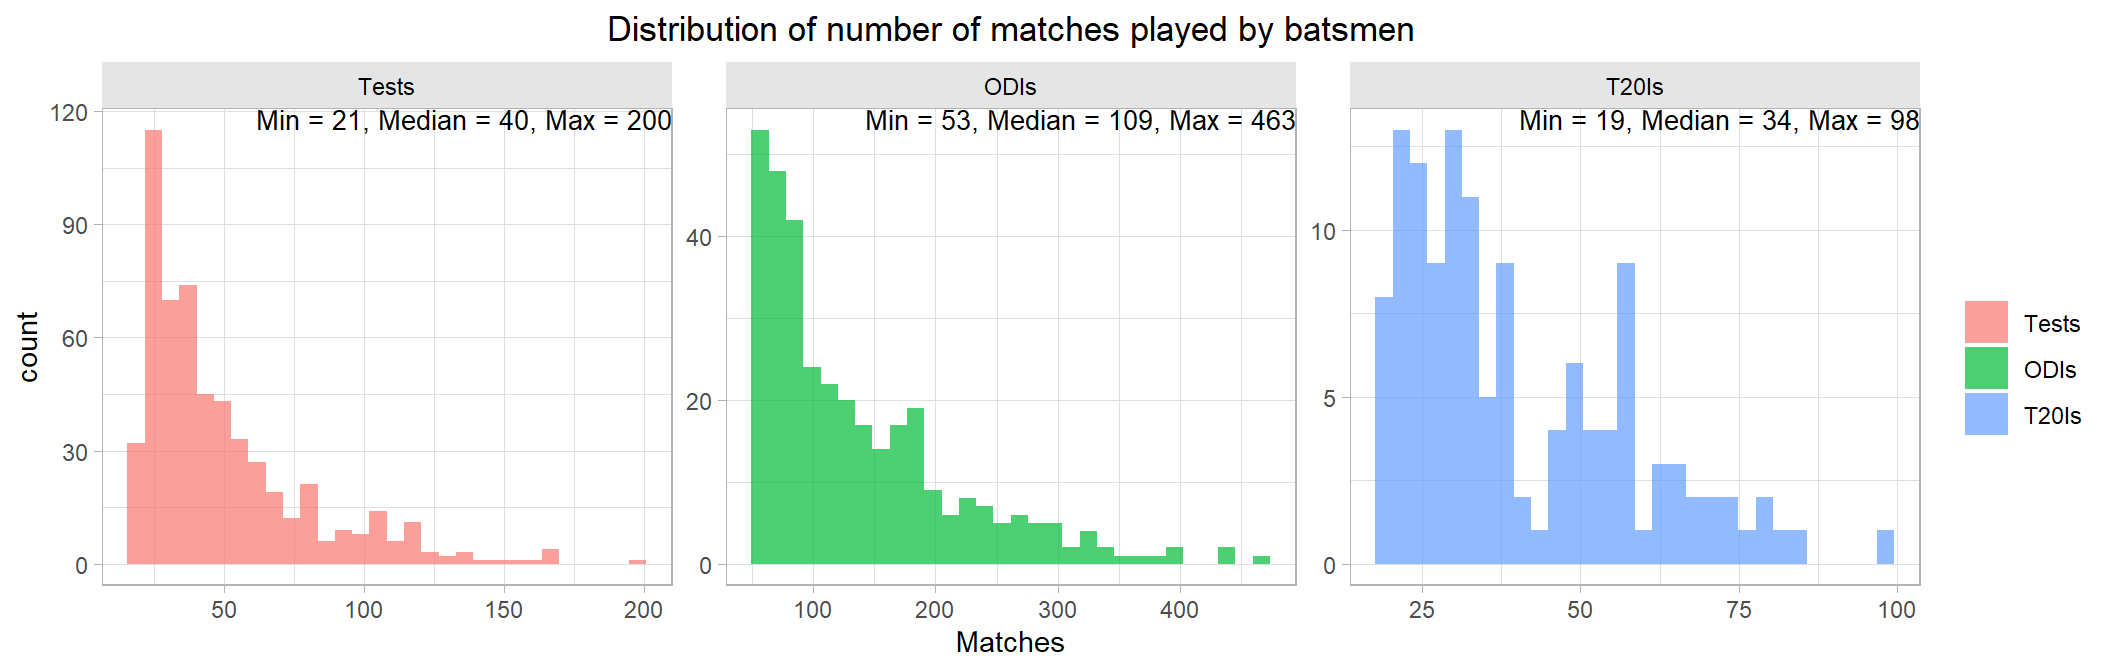
Distinguish batsmen from bowlers
To identify true batsmen in the dataset, I use 2 filters:
- Number of matches played should be above the 75th percentile
- Ratio of innings to matches played should be above the 25th percentile
The first filter eliminates newcomers and players who have had very short-lived careers. The second filter eliminates specialist bowlers from the dataset.
Let’s take a look at the distribution of these metrics for these batsmen. These numbers appear more reasonable.
Career averages of batsmen
Let’s take a look at the career batting averages of batsmen in each format. We see a few low averaging players left in the dataset who are potentially specialist bowlers. But without resorting to hand-picking, the two empirical filters chosen earlier did a good job of eliminating specialist bowlers from the dataset.
Career batting averages of batsmen in each format
Format: Tests
   Min. 1st Qu.  Median    Mean 3rd Qu.    Max.
   4.84   24.84   33.59   33.11   42.13   99.94
---------------------------------------------------------------------------
Format: ODIs
   Min. 1st Qu.  Median    Mean 3rd Qu.    Max.
   6.63   23.11   29.71   29.55   35.88   55.03
---------------------------------------------------------------------------
Format: T20Is
   Min. 1st Qu.  Median    Mean 3rd Qu.    Max.
4.10 18.15 21.91 23.27 28.44 53.40 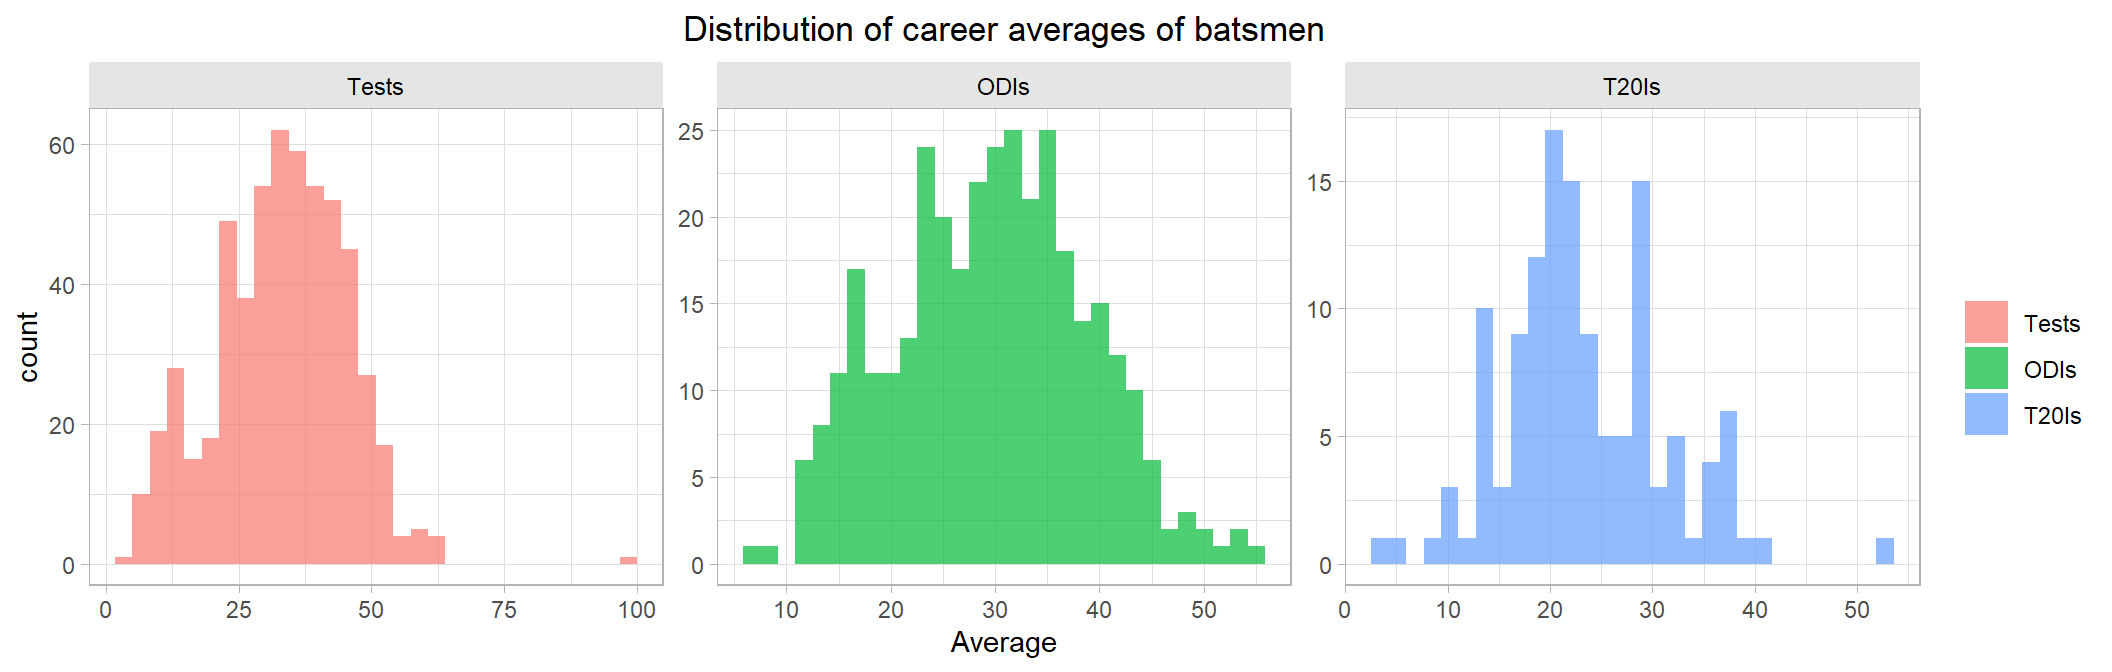
Top batsmen
The hallmark of a top batsman is consistency in scoring runs. From the distribution of career averages, it could be seen that very few batsmen have managed to score at an average of 50 or more runs in their career. So keeping things simple, this would be my sole criteria for selecting top batsmen amongst the rest. All batsmen who have averaged 50 or more in any format would be included in my list of top batsmen.
This gives us a unique list of 42 elite batsmen who are legendary in their achievements.
Let’s take a look how they compare by various stats.
Career Span
The career span of these elite batsmen is plotted in the order in which they debuted in their international career. Career spans of batsmen who are still actively playing in any format are labeled with blue color.
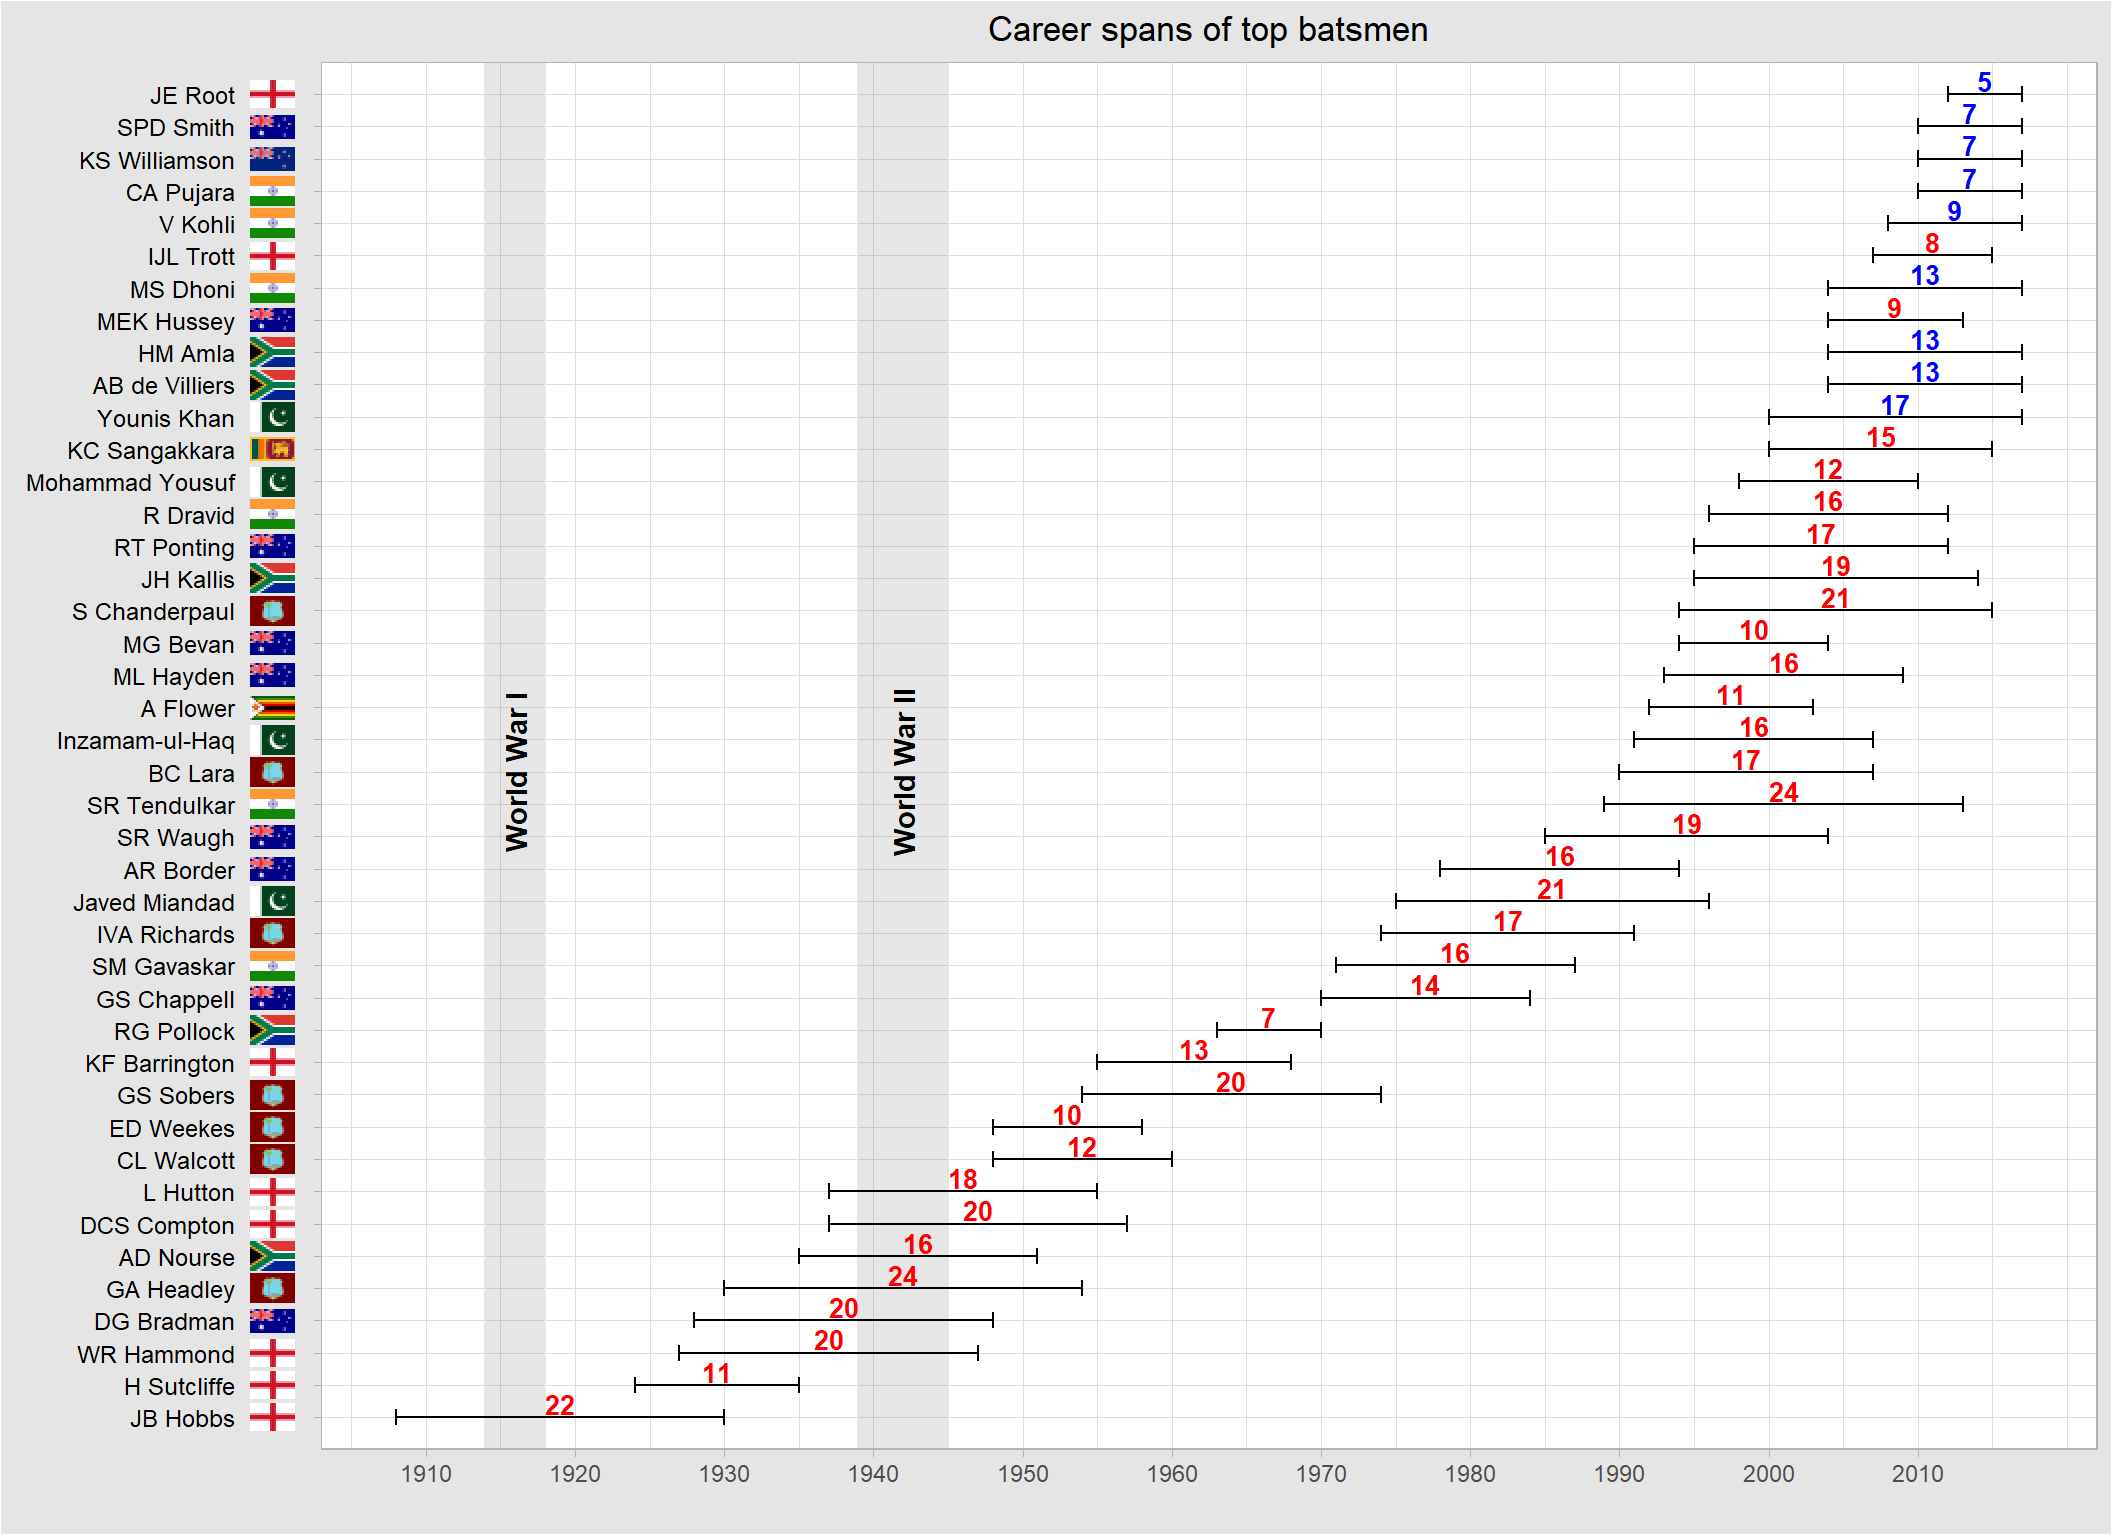
Summary of career spans in years of top batsmen
   Min. 1st Qu.  Median    Mean 3rd Qu.    Max.
   5.00   11.00   16.00   14.71   18.75   24.00
Sachin Tendulkar and George Headley have had the longest career spans of 24 years each. But the international career of Headley along with that of almost all of the early era greats were interrupted by world wars. So even though they resumed their careers after the end of the wars, they were able to play relatively few matches (more on this below).
Graeme Pollock has had the shortest career of 7 years amongst all retired players. Being a South African, his career was cut short when ICC suspended South Africa from competing internationally in 1970 because of apartheid.
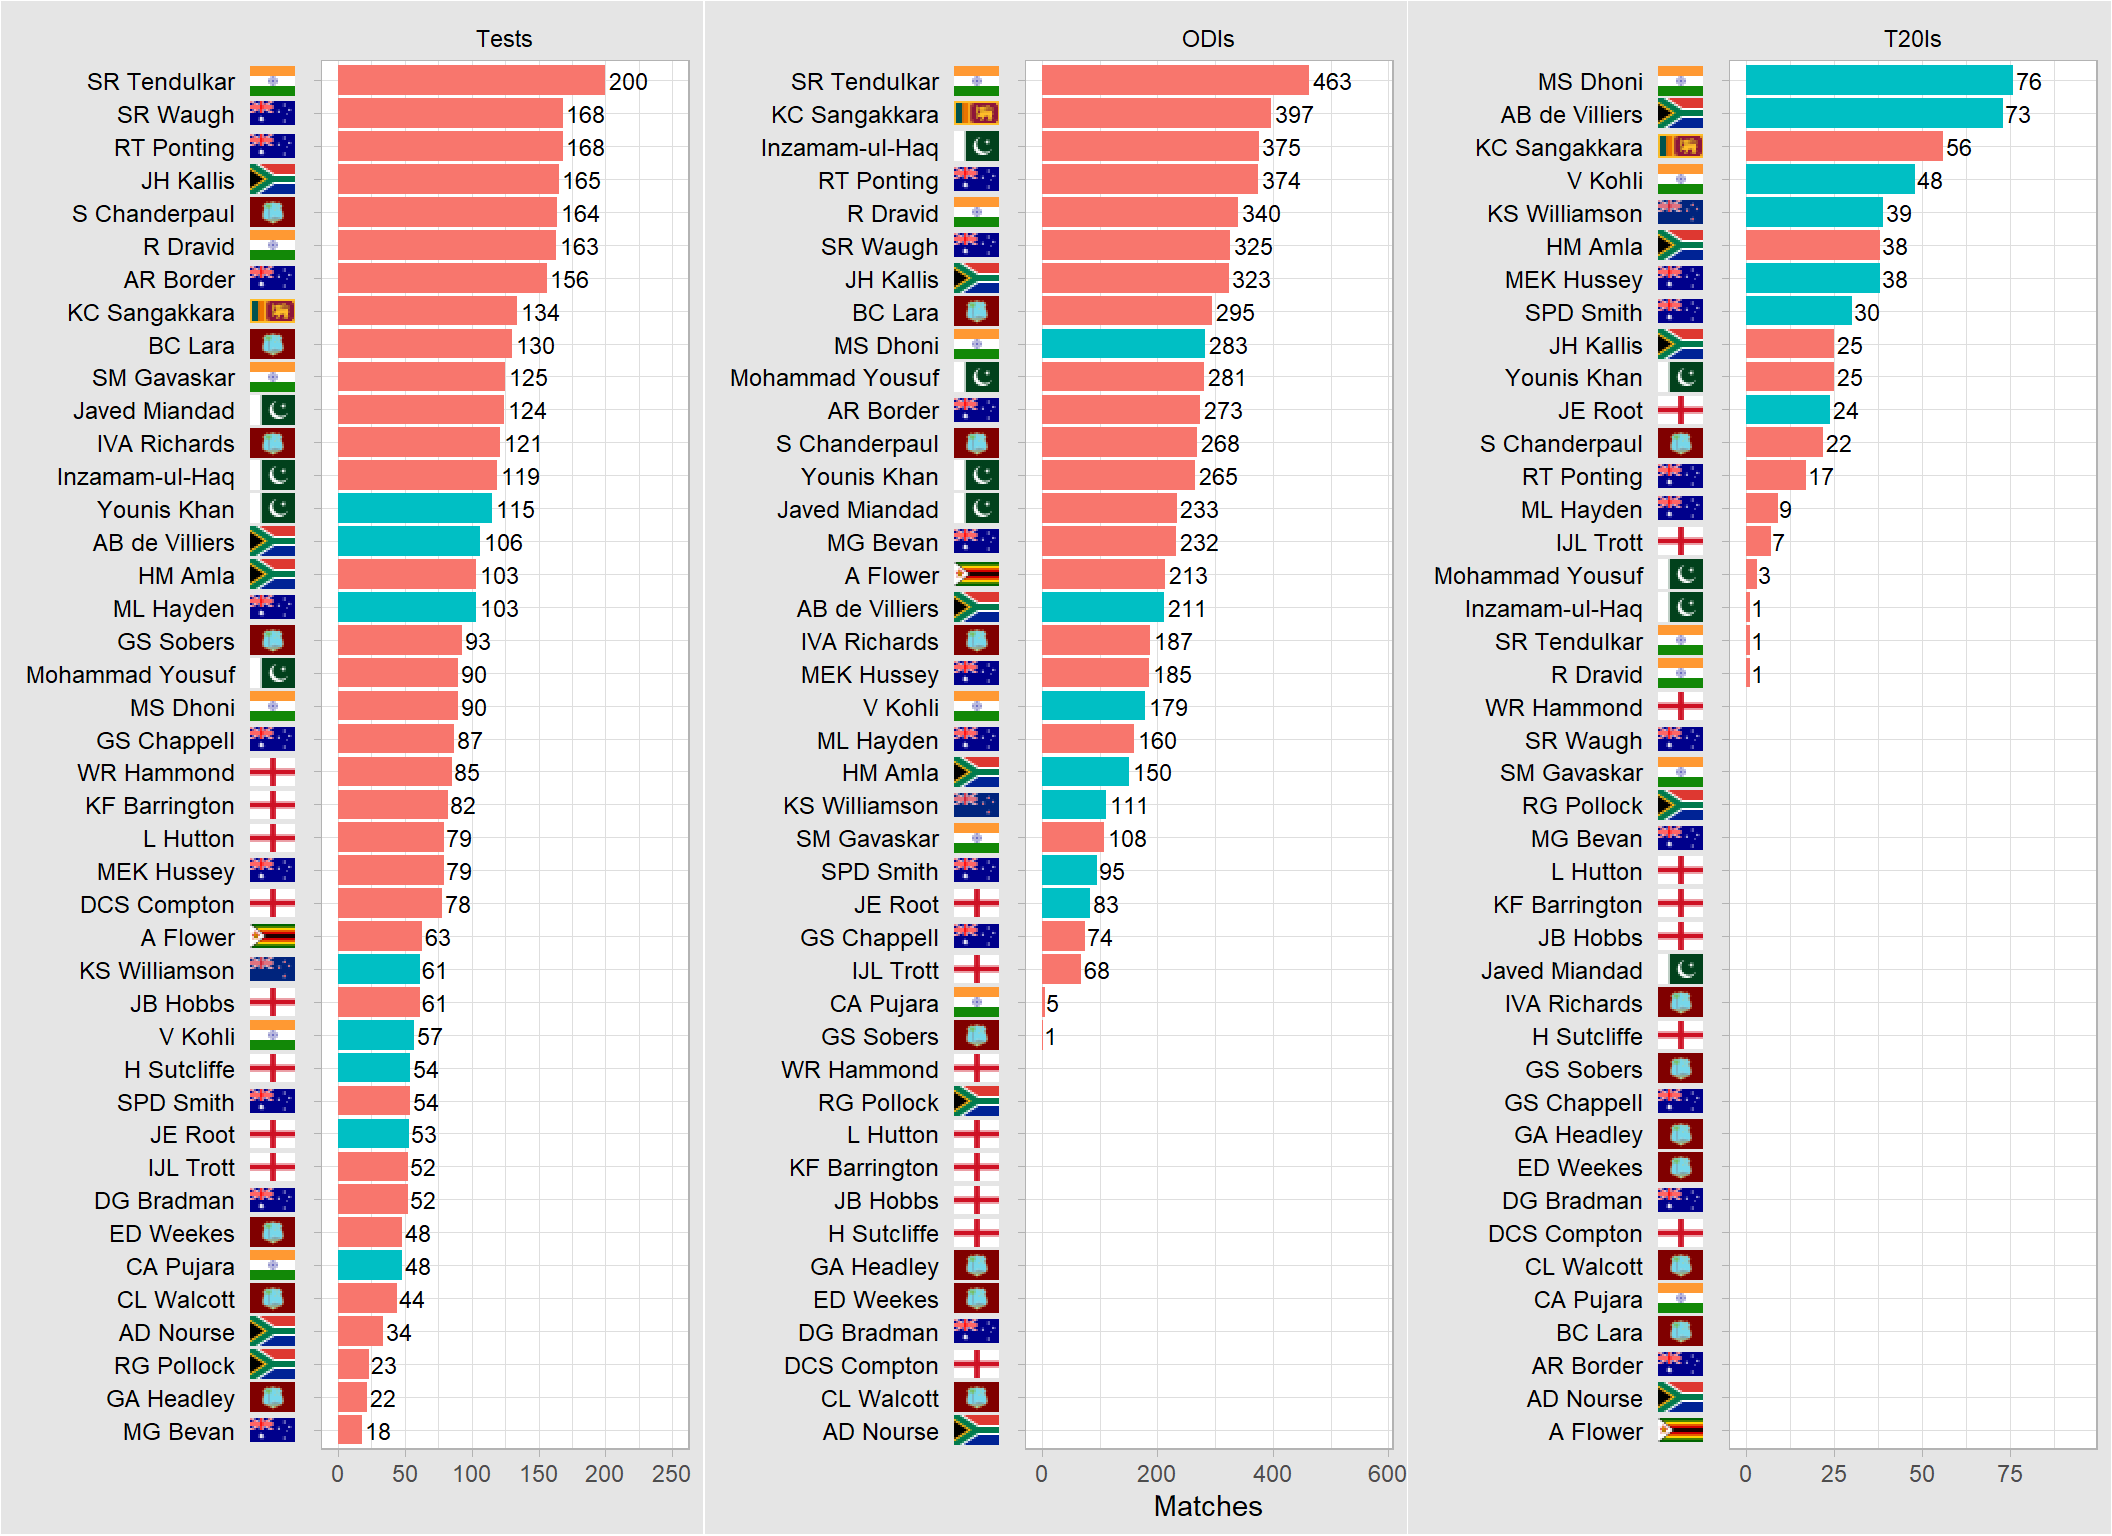
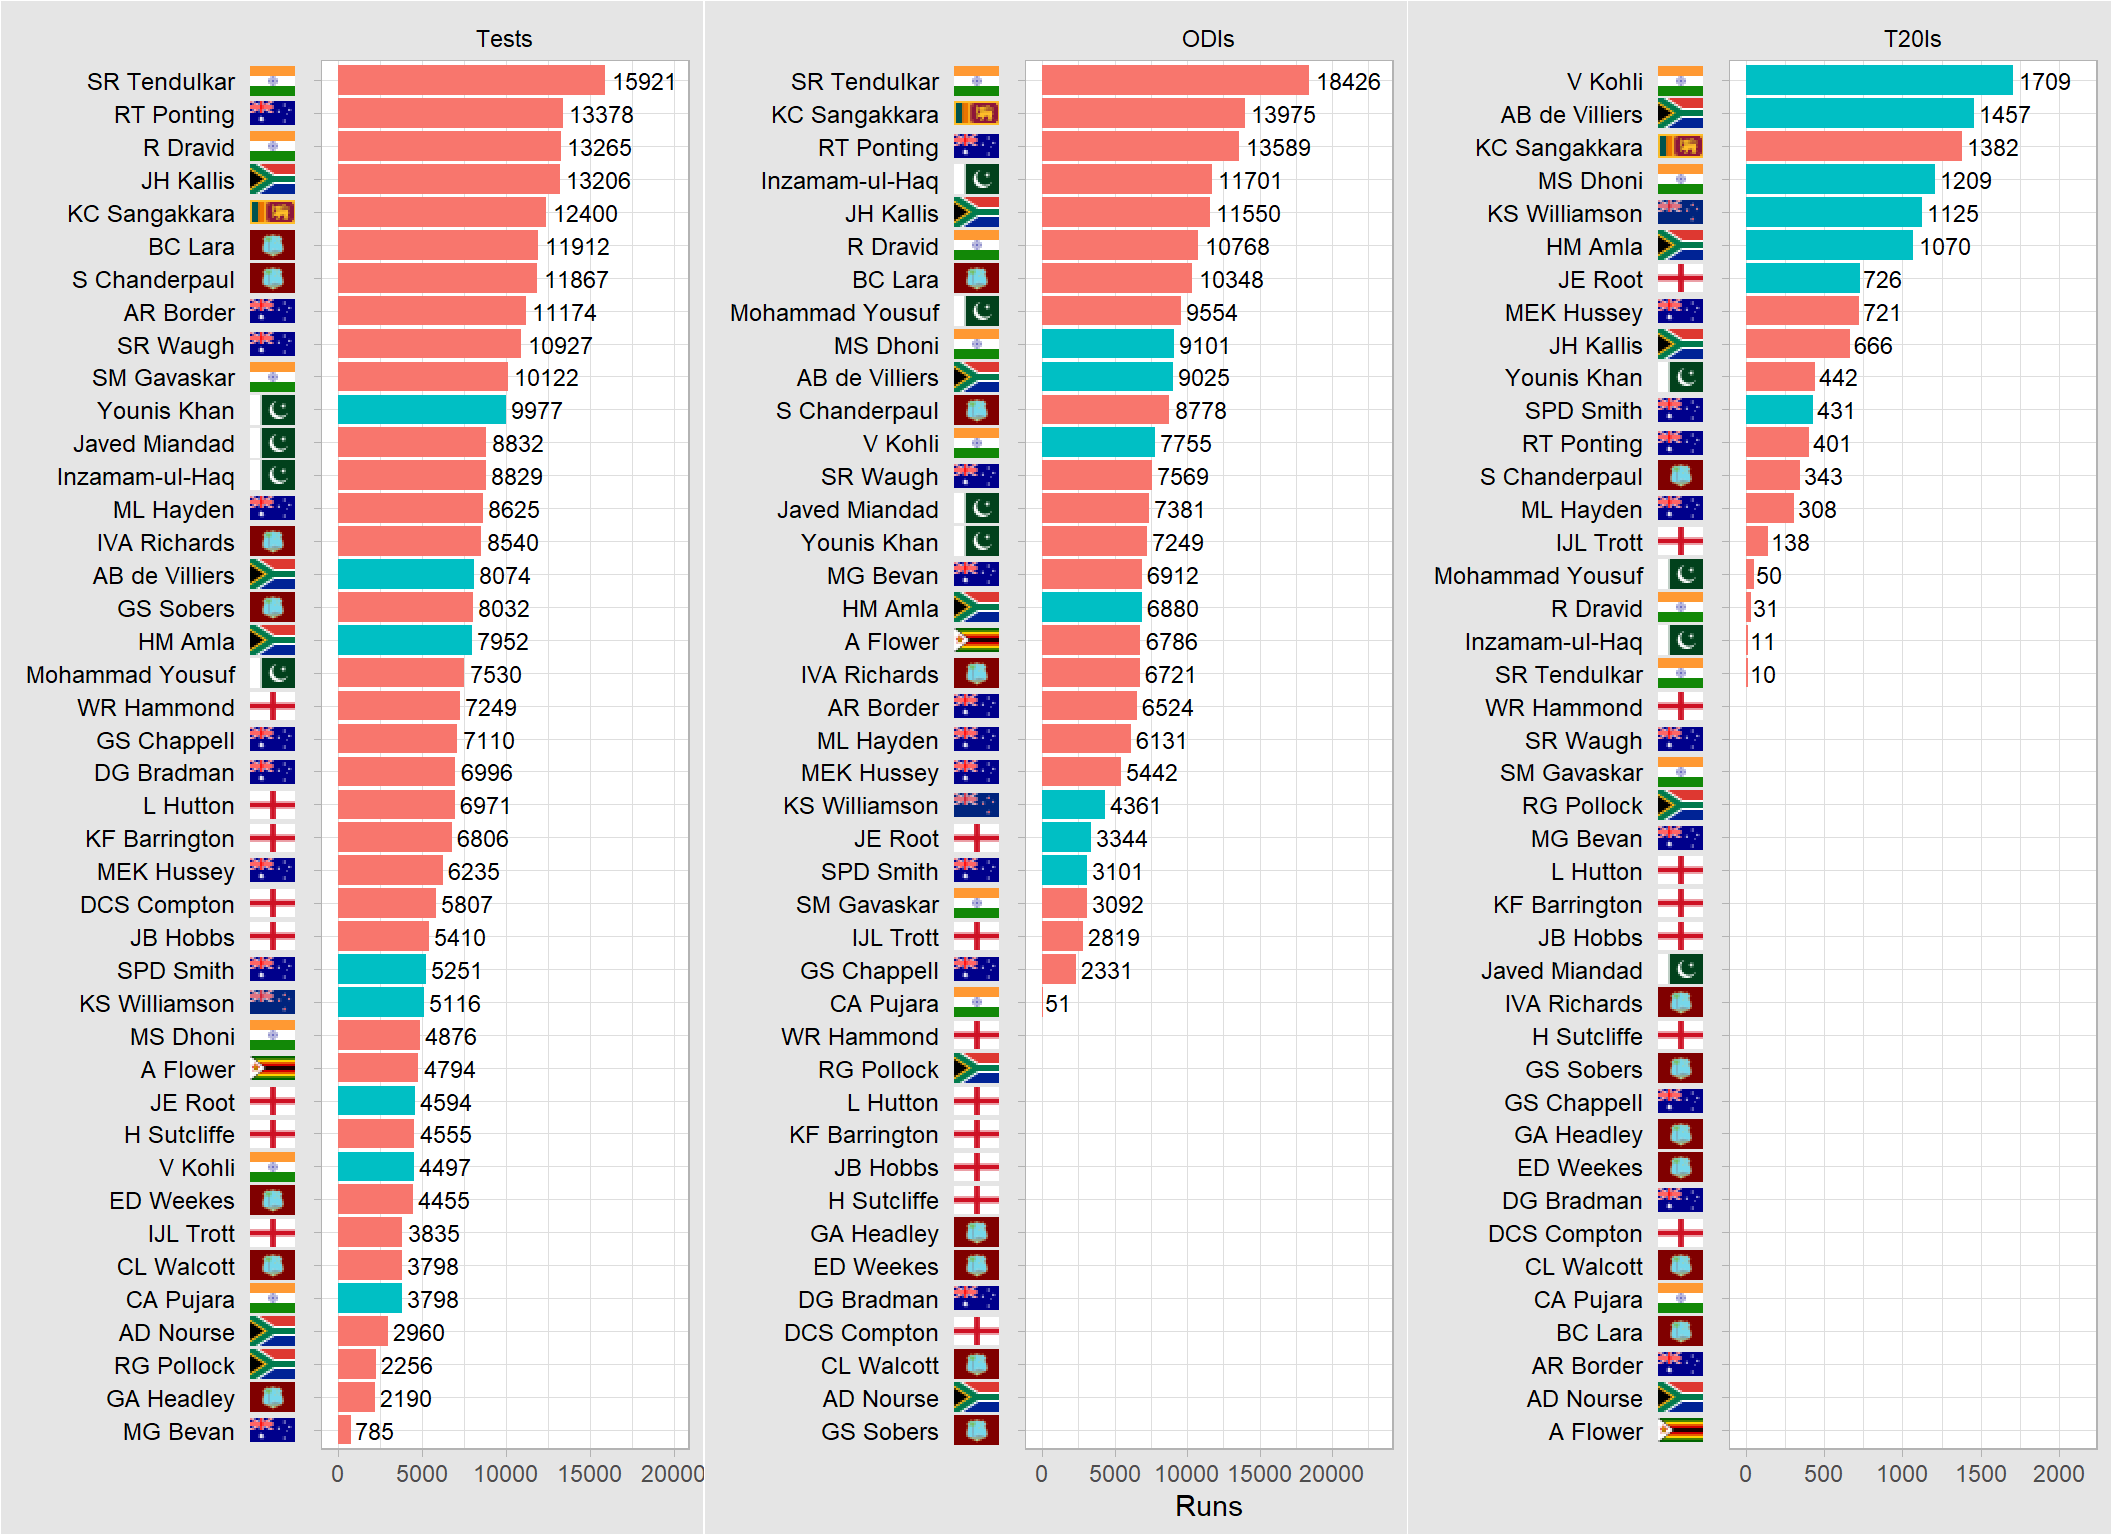
Number of matches played
Among the many records in Tendulkar’s name, the number of Tests and ODIs played are at the forefront. He played a single T20I, because he, Dravid and other senior members of the then Indian team used to withdraw their names for team selection in T20Is. His records of playing in 200 Tests and 463 ODIs are a testament to his brilliance, his passion for the game and his fitness over the years. Among the active players only AB de Villiers and Hashim Amla are at the halfway mark relatively to Tendulkar’s mark in Tests. But both AB and Amla are already well into their prime years. Younis Khan is on the verge of riding into the sunset. The rest of the pack including Virat Kohli, Kane Williamson, Steve Smith have a looong way to catch up.
It could be observed how few matches did the early era greats play relatively. Not only were few teams competing at the time, but also interruptions by world wars.
Michael Bevan established himself as an ODI specialist and played only 18 tests. Cheteshwar Pujara appears to have barely made the cutoffs for this list. He is a Tests specialist.
Career runs scored
Once again Tendulkar’s records here are at the top. It is highly unlikely that any other batsman could ever come close in the next 5-10 years.
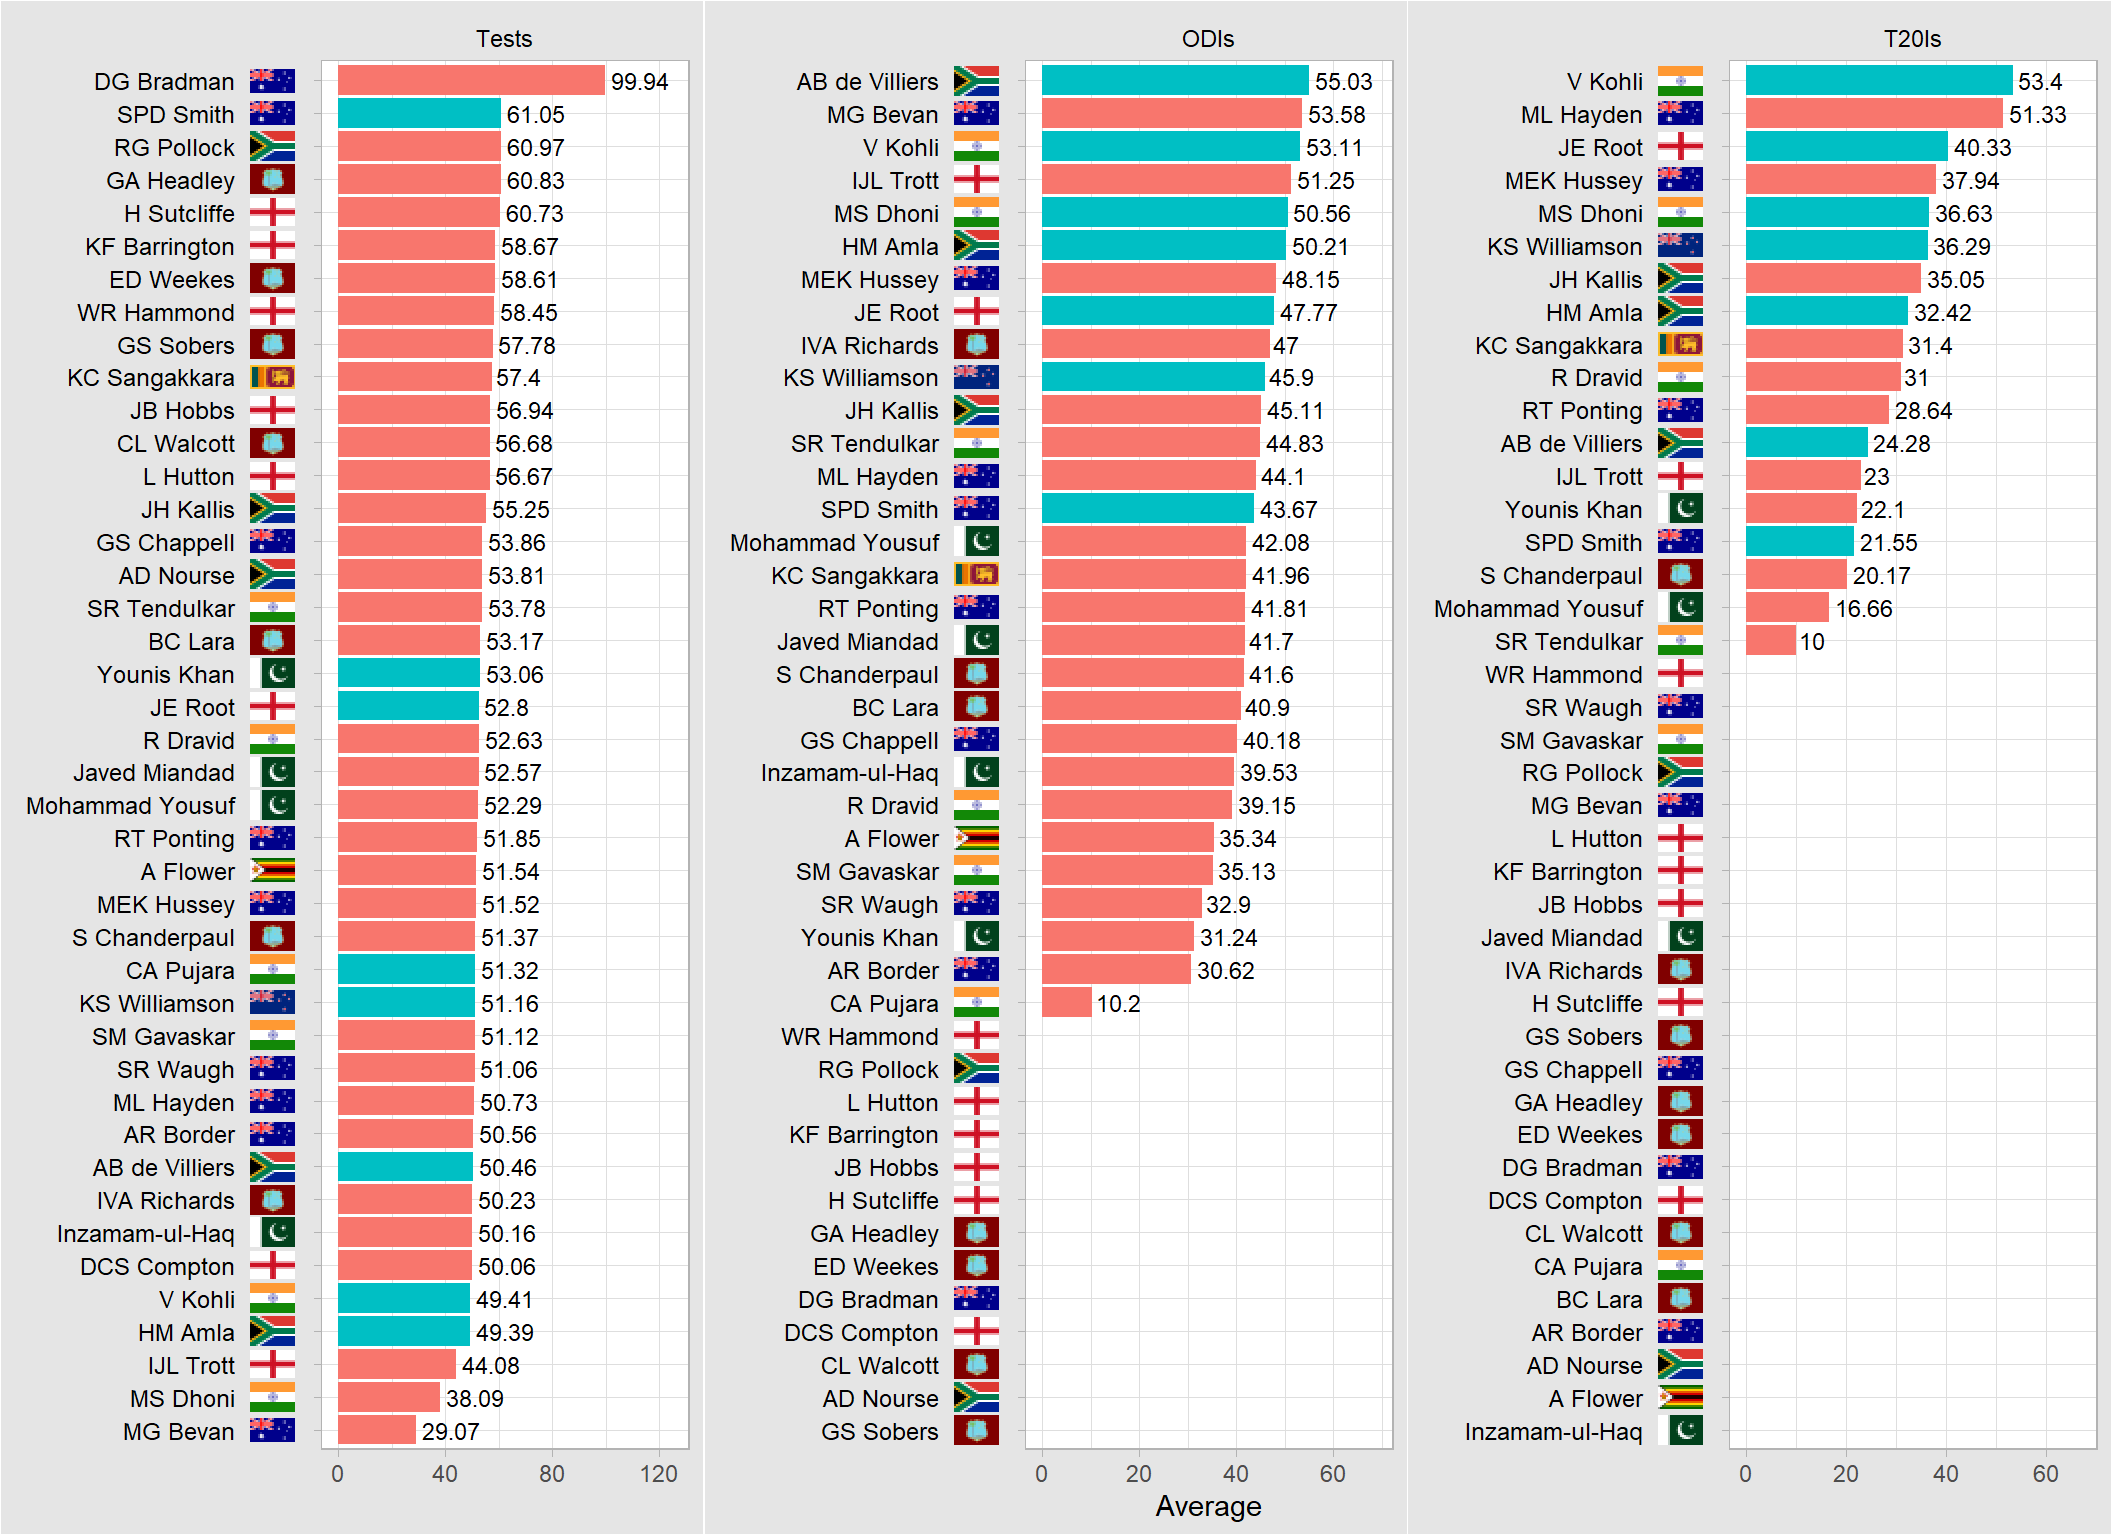
Career batting averages
First and foremost is Sir Don Bradman’s career batting average record of 99.94 in Tests. He is widely regarded to be the greatest batsman of all time. This is one record that’s impossible to beat. The second batsman on this list is Graeme Pollock at 60.97. Steve Smith is the only active batsman who is anywhere close to second, a phenomenal achievement in its own right.
Secondly, it becomes clear why each batsman was selected for this list, a batting average of 50 or more in any single format. Though most batsmen have a Tests average above 50, Jonathan Trott, MS Dhoni and Michael Bevan made it by virtue of their superlative averages in the ODIs.
Virat Kohli is the only batsman who has averaged above 50 in all the 3 formats.
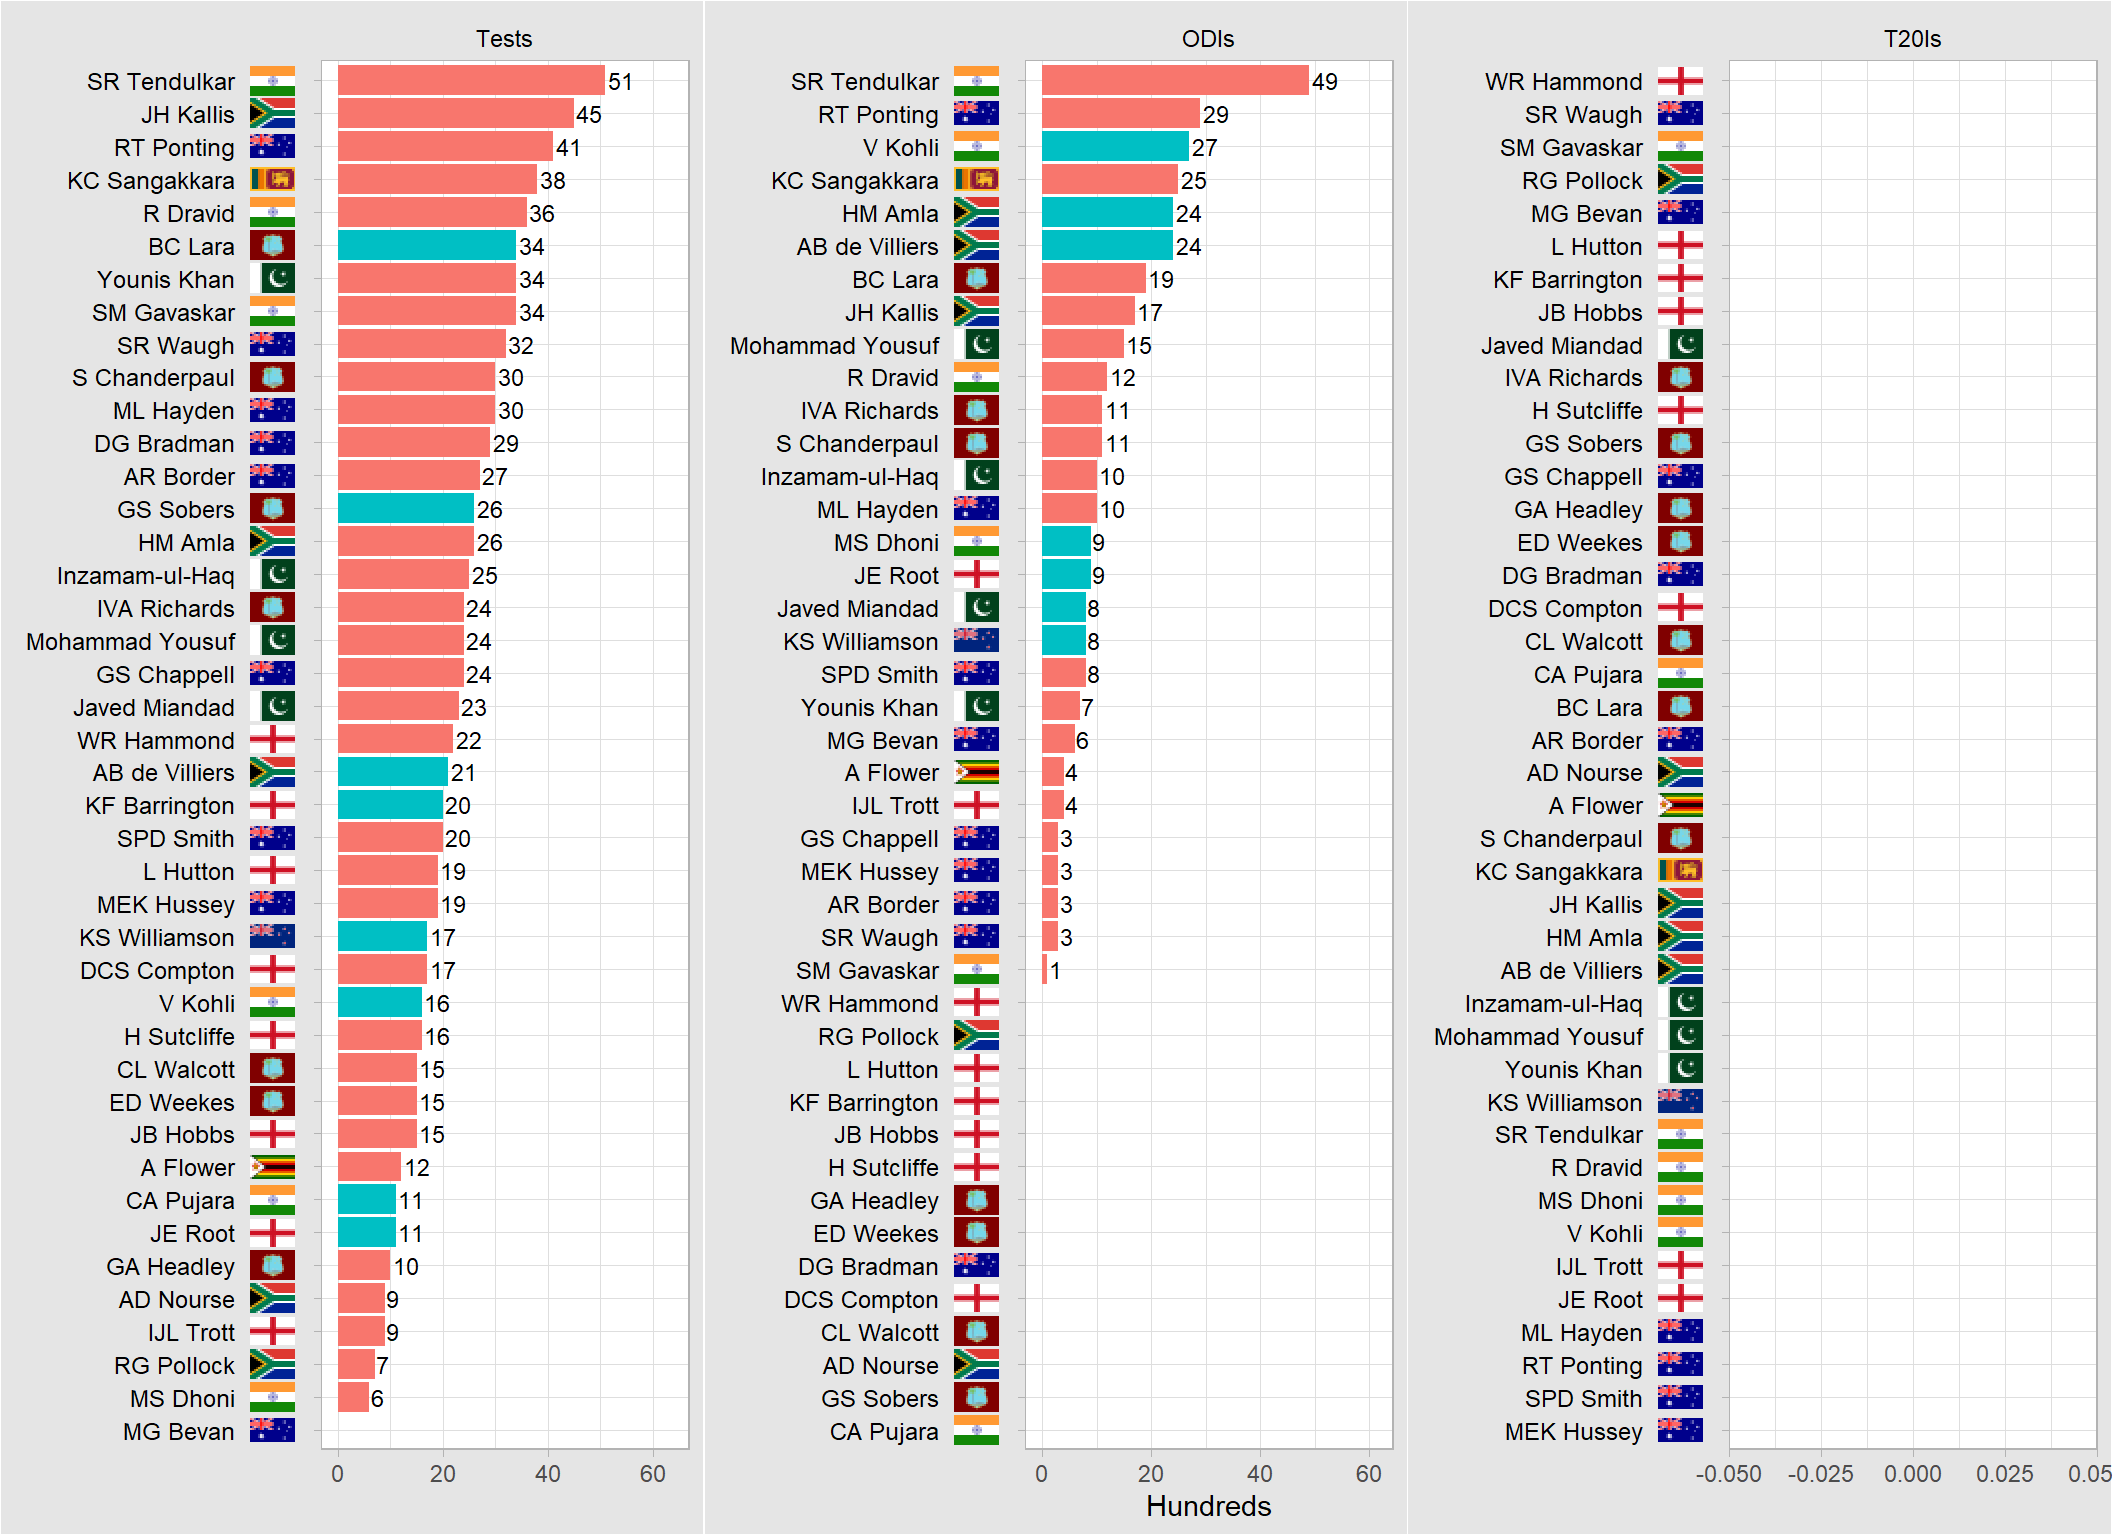
Hundreds scored in career
Once again Tendulkar leads in the standings with 51 hundreds in Tests and 49 hundreds in ODIs. Sir Don’s record Test average of 99.94, Tendulkar’s records of number of matches played, runs scored and hundreds scored in career are some of the records that are going to be next to impossible to beat.
Surprisingly none of the batsmen on this list have scored a hundred in T20Is. There are a few other batsmen who have scored hundreds in T20Is but none of them were consistent enough to make it to this list.
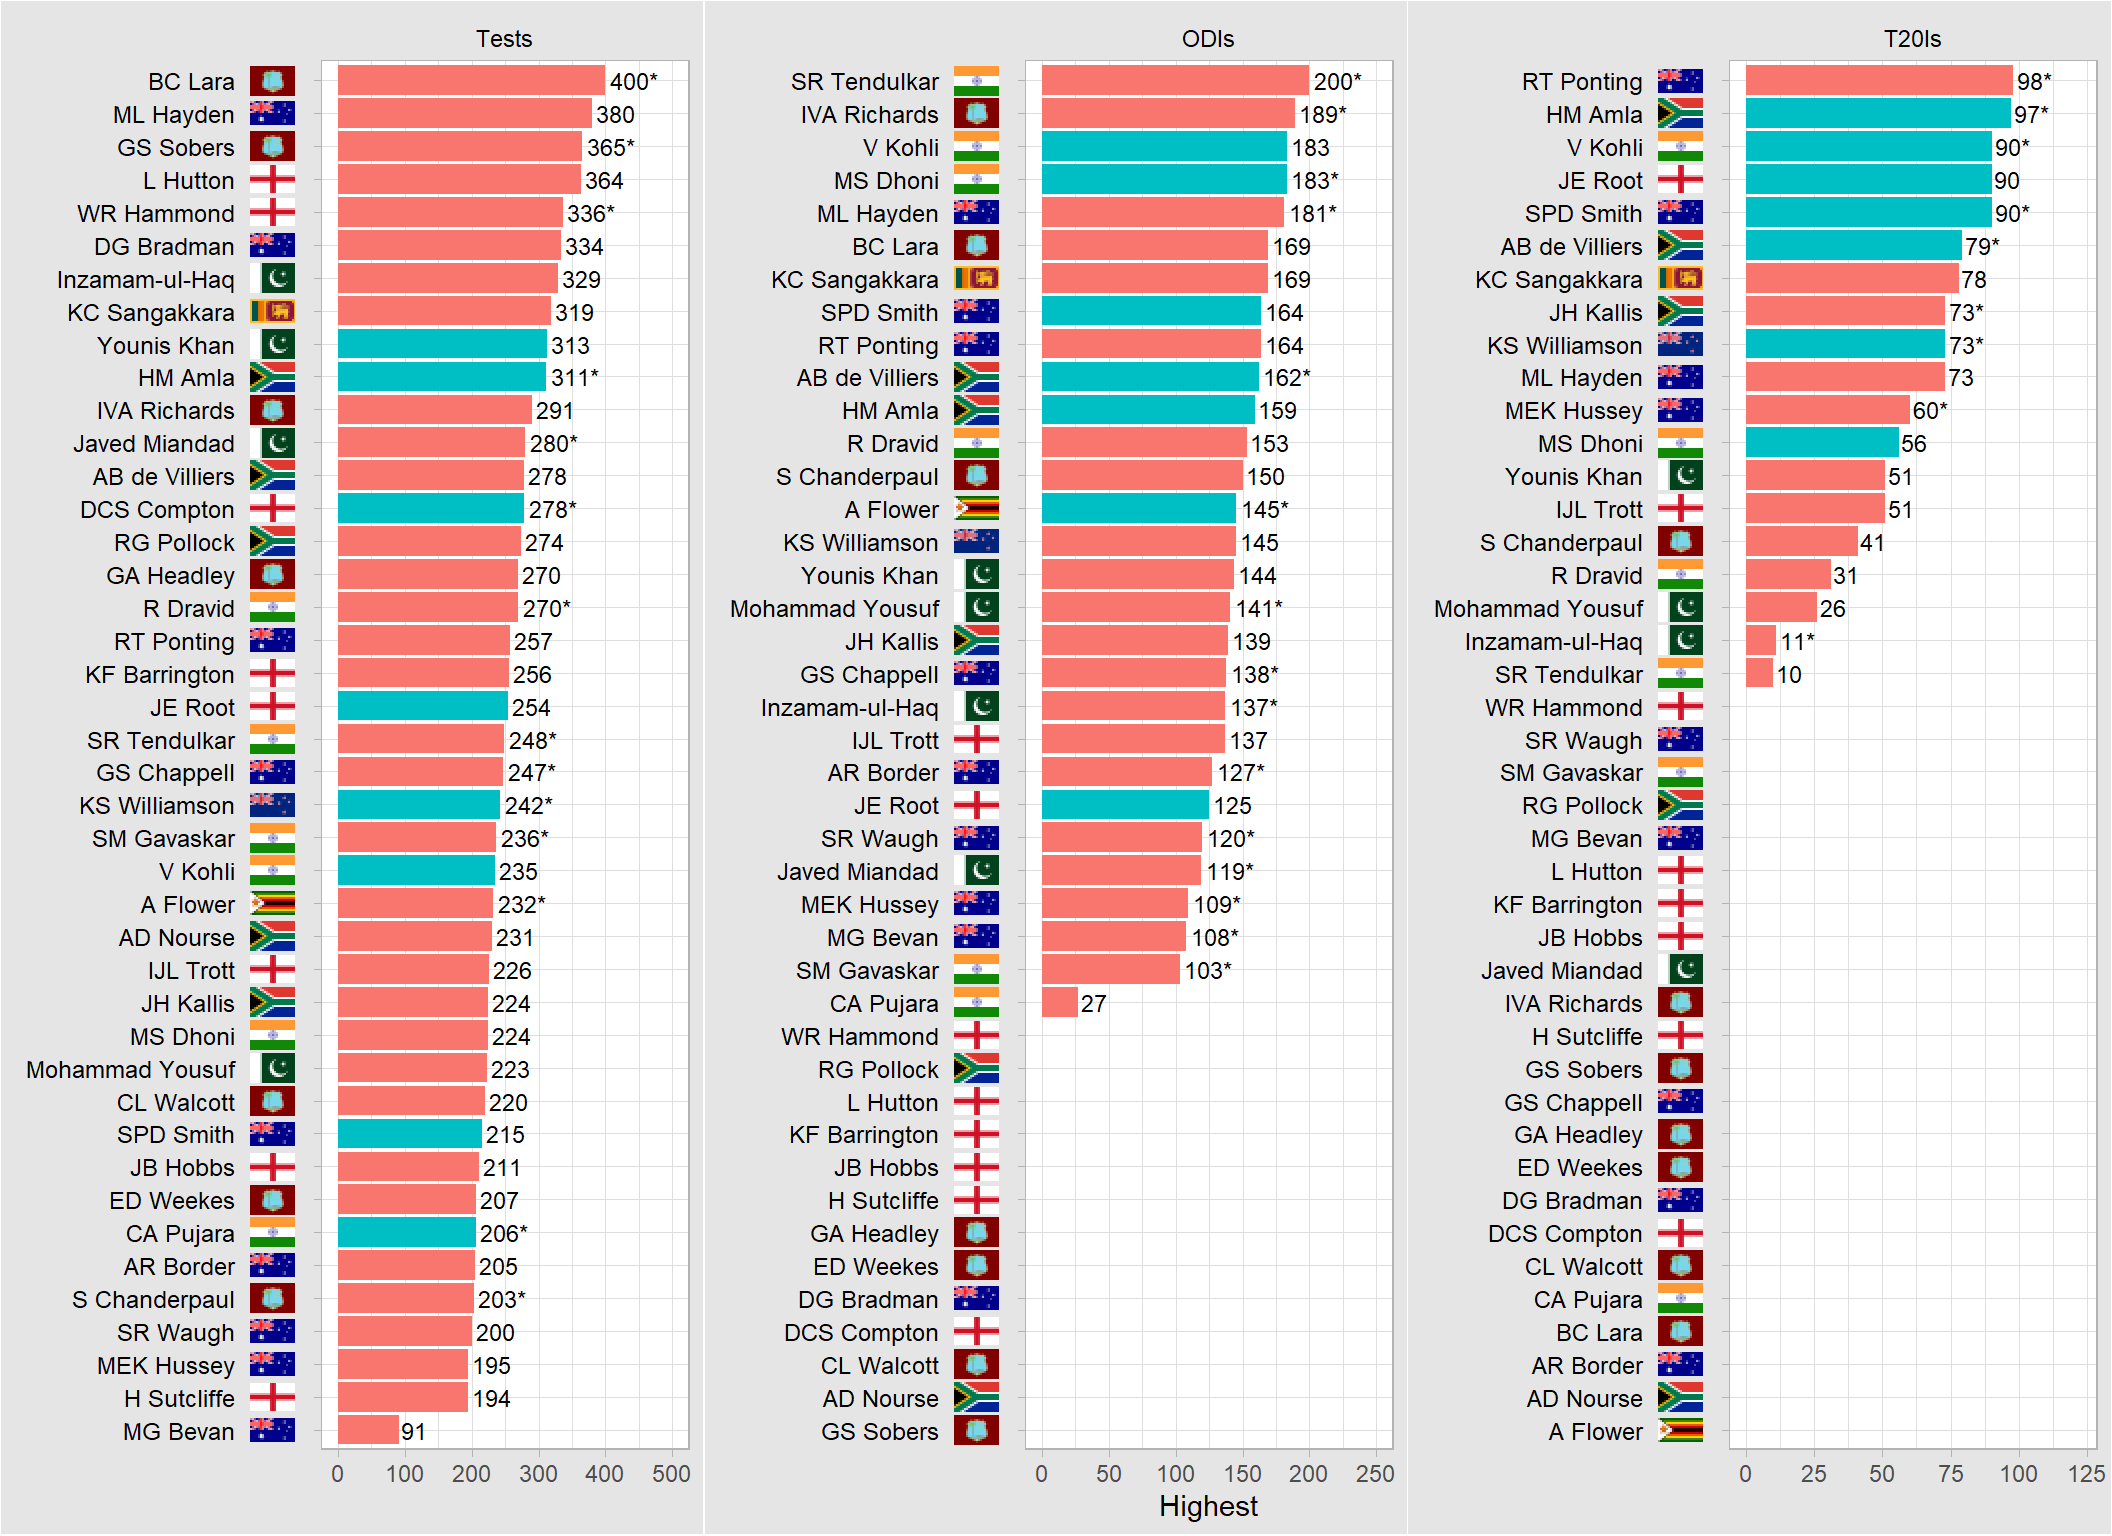
Highest scores in an innings
Here we see the great Brian Lara at the top of the Tests table with a highest score of 400 not out. I remember Sir Garfield Sobers’ score of 365 not out was one of the longest standing records in Test cricket until Lara surpassed it. Only Matthew Hayden was able to come any closer to Lara.
In ODIs, it was apt that the champion, Sachin Tendulkar was the first one to score a double hundred. A few other batsmen have scored 200+ scores in ODIs since, but none have had the consistency that Tendulkar had.
In T20Is, as mentioned above none of these batsman scored a hundred. Though a few have come close. I expect some of the active players to reach this milestone in the near future.