A brief history of cricket
Since early childhood, I have been a big fan of cricket. Some of my earliest childhood memories are watching the game along with my loved ones in India. As much as I can recall, the first series I saw was between India and the West Indies during the early 80s, on a black and white TV set. Watching Sunil Gavaskar play the fearsome West Indian fast bowlers with aplomb, made me his fan…until a kid named Sachin Tendulkar arrived in 1989.
As the saying goes…In India, cricket is religion and Tendulkar is God! Even after his retirement in 2013, Tendulkar is still the most loved sportsperson or celebrity in India. A billion people passionately follow the game and voice their opinion on matters of team selection, players’ performances, umpiring…you name it. Armchair analysts abound, especially if the Indian cricket team loses a consequential match or a series.
I was excited to find that detailed records and stats on all cricket players were available on Statsguru. The database covers all formats of the game:
- Tests - Test matches (80 overs a day, each team playing upto 2 innings in 5 days)
- ODIs - One-Day Internationals (50 overs an innings)
- T20Is - Twenty20 Internationals (20 overs an innings)
In this post, I’ve tried to examine a brief history of the game using the debut years and career spans of players.
Here’s a sample of batting data:
| Player | Span | Mat | Inns | NO | Runs | HS | Ave | BF | SR | 100 | 50 | 0 | |
|---|---|---|---|---|---|---|---|---|---|---|---|---|---|
| 1 | RT Ponting | 1995-2012 | 374 | 364 | 39 | 13589 | 164 | 41.81 | 16944 | 80.19 | 29 | 82 | 20 |
| 2 | AC Gilchrist | 1996-2008 | 286 | 278 | 11 | 9595 | 172 | 35.93 | 9902 | 96.89 | 16 | 55 | 19 |
| 3 | ME Waugh | 1988-2002 | 244 | 236 | 20 | 8500 | 173 | 39.35 | 11053 | 76.9 | 18 | 50 | 16 |
| 4 | MJ Clarke | 2003-2015 | 245 | 223 | 44 | 7981 | 130 | 44.58 | 10104 | 78.98 | 8 | 58 | 10 |
| 5 | SR Waugh | 1986-2002 | 325 | 288 | 58 | 7569 | 120* | 32.90 | 9971 | 75.91 | 3 | 45 | 15 |
| 6 | MG Bevan | 1994-2004 | 232 | 196 | 67 | 6912 | 108* | 53.58 | 9320 | 74.16 | 6 | 46 | 5 |
Here’s a sample of bowling data:
| Player | Span | Mat | Inns | Balls | Runs | Wkts | BBI | Ave | Econ | SR | 4 | 5 | |
|---|---|---|---|---|---|---|---|---|---|---|---|---|---|
| 1 | B Lee | 2000-2012 | 221 | 217 | 11185 | 8877 | 380 | 5/22 | 23.36 | 4.76 | 29.4 | 14 | 9 |
| 2 | GD McGrath | 1993-2007 | 249 | 247 | 12928 | 8354 | 380 | 7/15 | 21.98 | 3.87 | 34.0 | 9 | 7 |
| 3 | SK Warne | 1993-2003 | 193 | 190 | 10600 | 7514 | 291 | 5/33 | 25.82 | 4.25 | 36.4 | 12 | 1 |
| 4 | MG Johnson | 2005-2015 | 153 | 150 | 7489 | 6038 | 239 | 6/31 | 25.26 | 4.83 | 31.3 | 9 | 3 |
| 5 | CJ McDermott | 1985-1996 | 138 | 138 | 7461 | 5018 | 203 | 5/44 | 24.71 | 4.03 | 36.7 | 4 | 1 |
| 6 | SR Waugh | 1986-2002 | 325 | 207 | 8883 | 6761 | 195 | 4/33 | 34.67 | 4.56 | 45.5 | 3 | 0 |
Currently there are 10 international teams which have full-membership of the International Cricket Council - Australia, Bangladesh, England, India, New Zealand, Pakistan, South Africa, Sri Lanka, West Indies and Zimbabwe. I downloaded batting and bowling data for all of these 10 teams in all 3 formats. The dataset is rich with features and appears to cover the entire history of international cricket.
Major props to the folks at Statsguru for maintaining a clean dataset. Both batting and bowling datasets have the same number of players, as should be the case. So there wasn’t much data wrangling needed.
Here are what the abbreviations mean:
| Term | Description |
|---|---|
| Span | Separate into debut year and last year of career |
| Mat | Matches played in career |
| Inns | Innings played in career |
| NO | Number of times not out in career |
| HS | Highest batting score in career |
| Ave | Career Average, batting: Runs/(Innings - NotOuts), bowling: Runs/Wickets |
| BF | Balls Faced |
| SR | Strike Rate, batting: Runs/Balls Faced, bowling: Balls/Wickets |
| BBI | Best bowling performance in an innings |
| Balls | Number of balls bowled in career |
| Wkts | Number of wickets in career |
| Econ | Bowling economy rate: Runs per over (Overs bowled = Balls bowled/6) |
| 100 | Number of hundreds scored in career |
| 50 | Number of fifties scored in career |
| 4 | Number of times the bowler took 4 wickets in an innings |
| 5 | Number of times the bowler took 5 or more wickets in an innings |
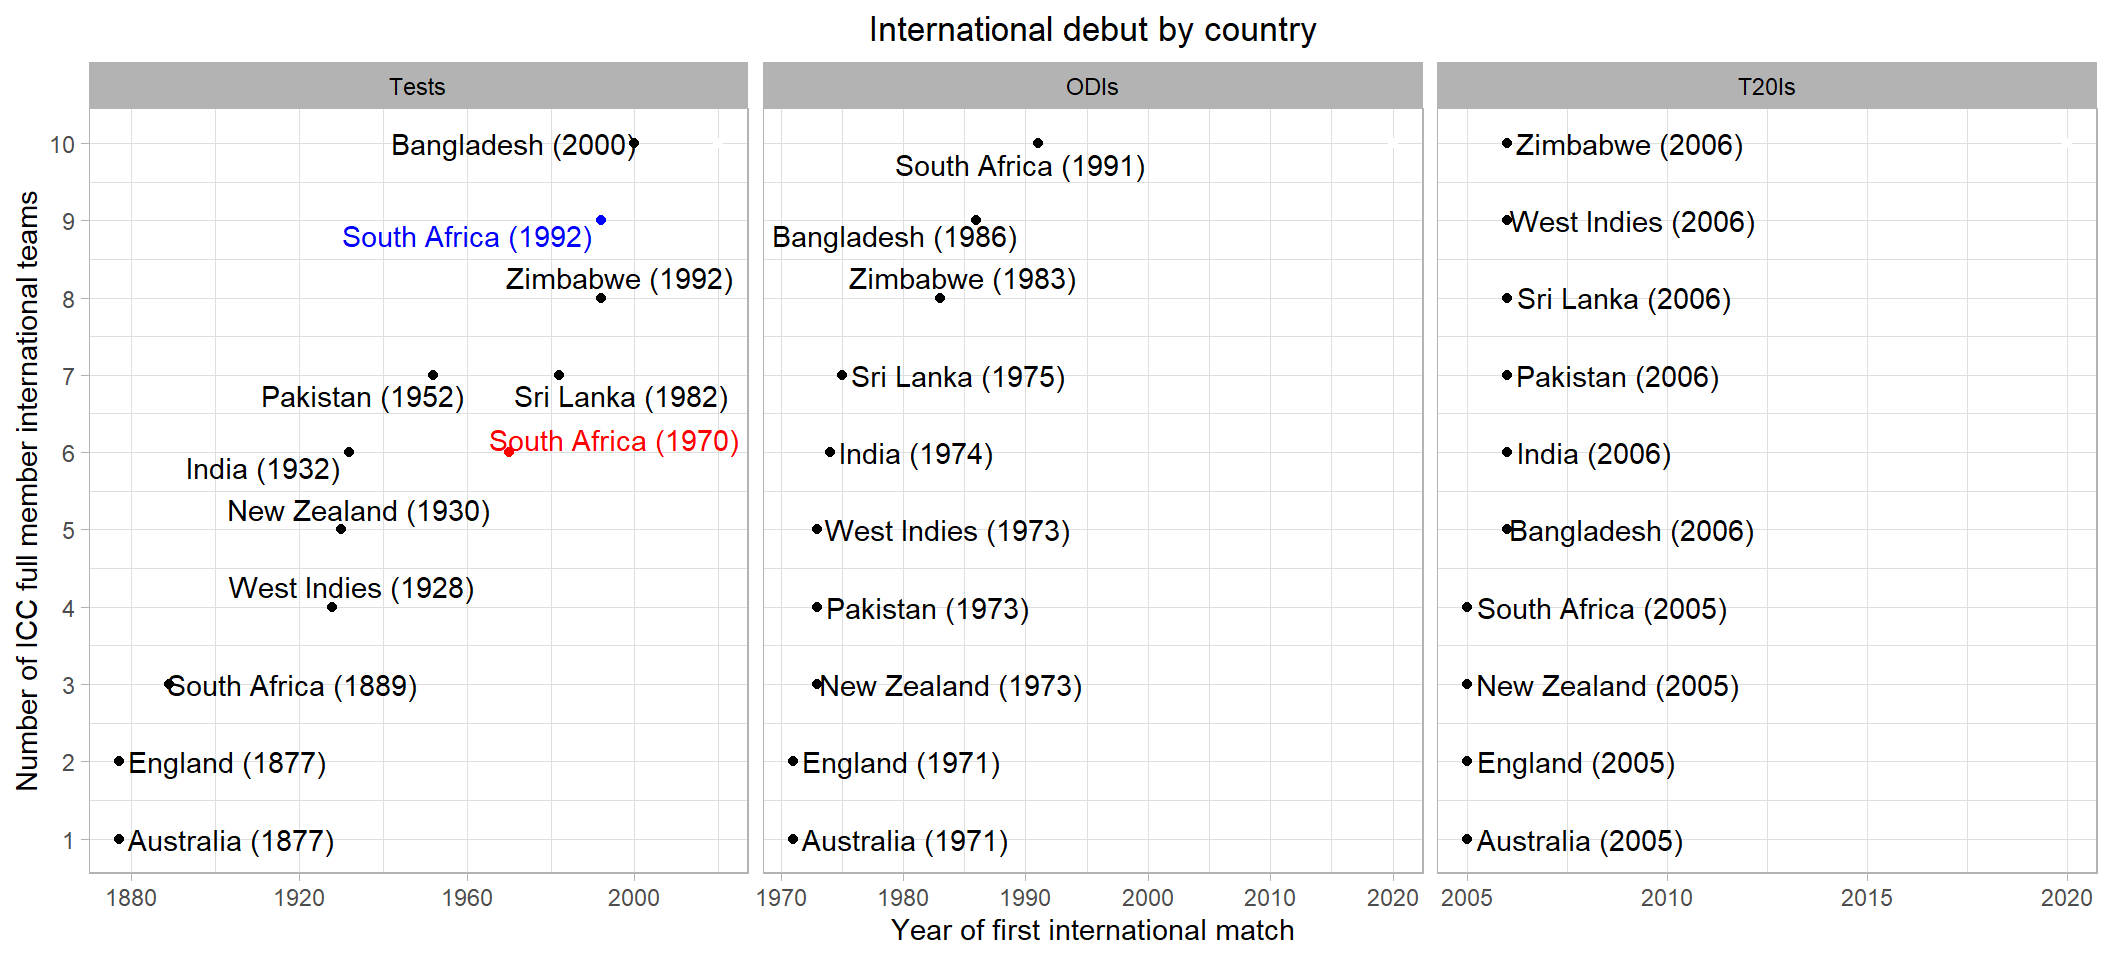
When did each country first play internationally?
From the earliest debut years of players, it could be seen when each format was started and when each country started playing in a format. Australia and England have been the pioneering nations in each format. The earliest Tests were played between Australia and England in 1877. South Africa joined the fray in 1889. For the next 40 years, these were the only 3 international teams, until West Indies, India and New Zealand started playing in quick succession. In 1970 South Africa was suspended from playing international cricket by the ICC because of prevailing apartheid in the nation. As a result, the international career of some very promising South Africans like Graeme Pollock and Barry Richards ended abruptly. Later on some other players emigrated to England and Australia to get a chance to play internationally. This ban was lifted by the ICC in 1991. The newly formed South African team under Clive Rice was given a warm welcome in India, when they visited to play ODIs. South Africa resumed playing tests in 1992.
Sri Lanka, Zimbabwe and Bangladesh were Associate members with ODI status before they were elected as full members to be eligible to play Tests.
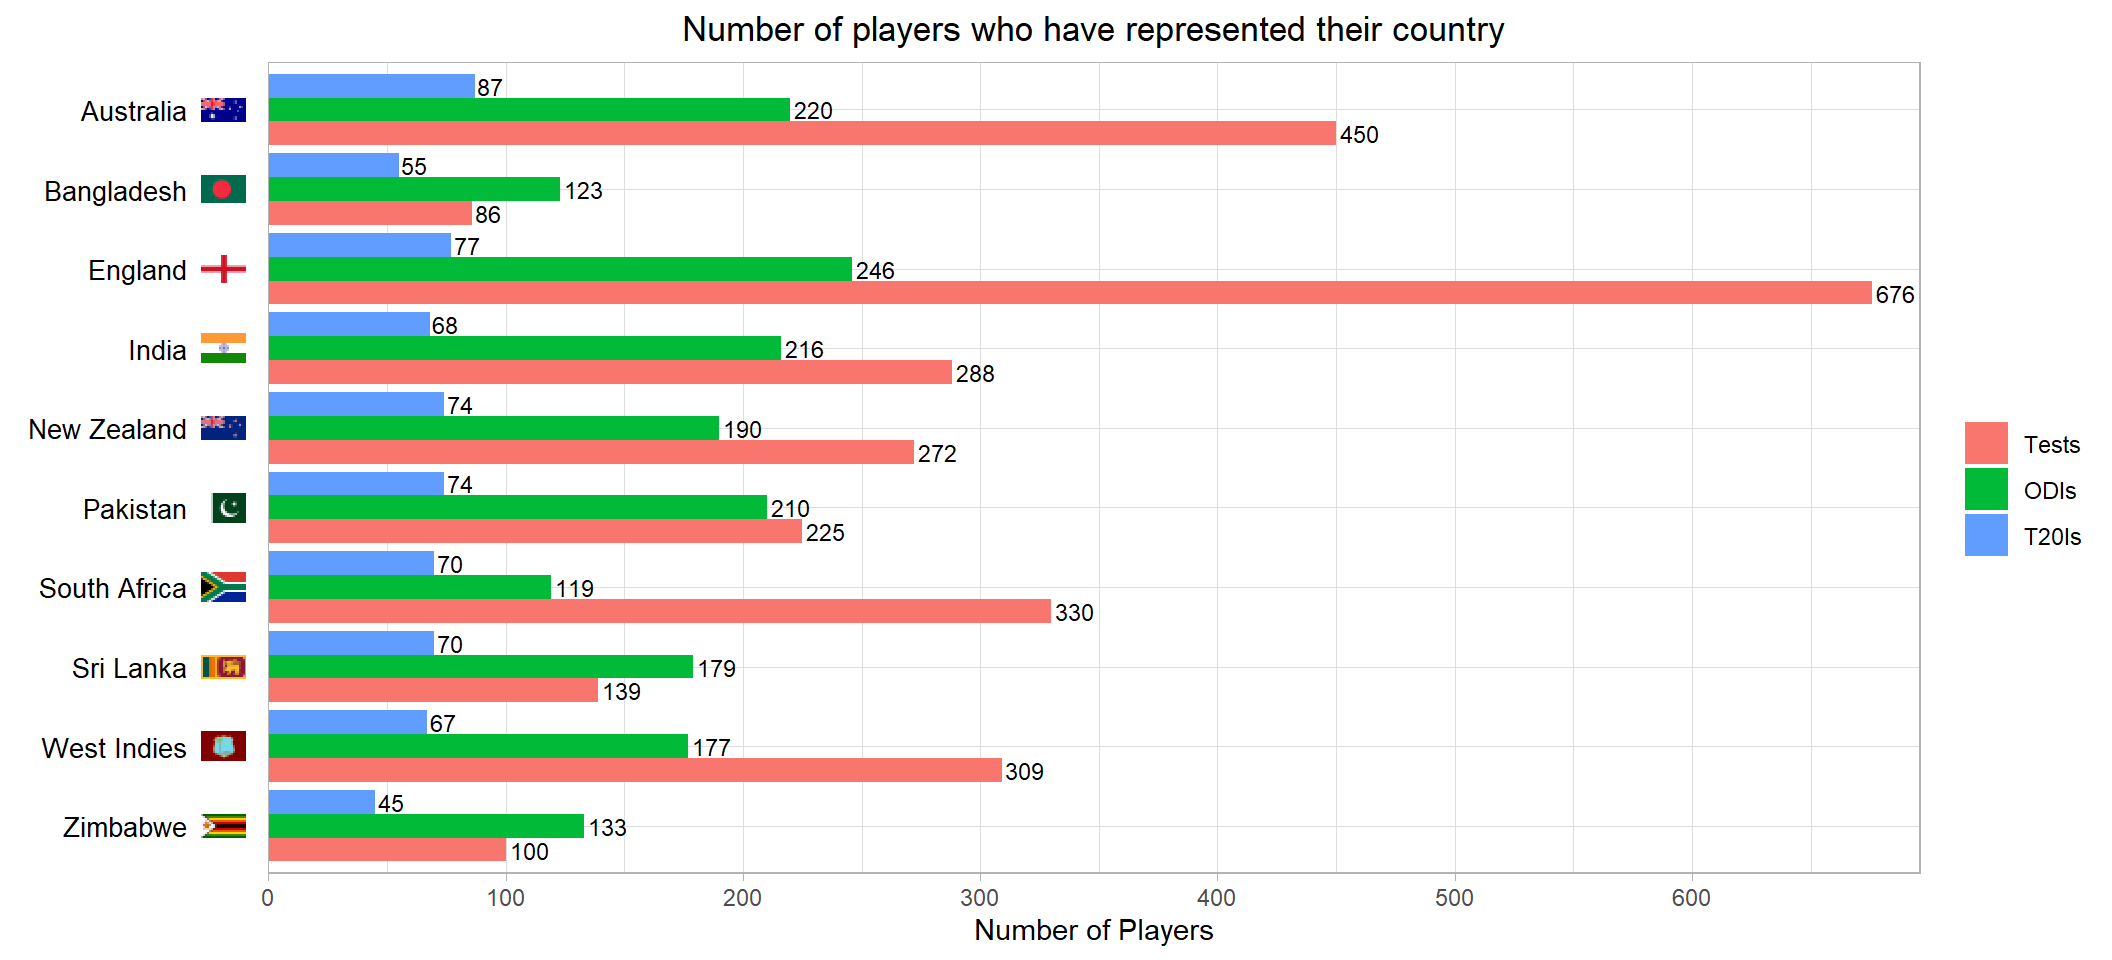
Number of players who have represented their country internationally
Even though Australia and England started playing Tests together in 1877, there have been far more players representing the England team in Tests, when looking at the entire history. This suggests a lot more turnover in the English team.
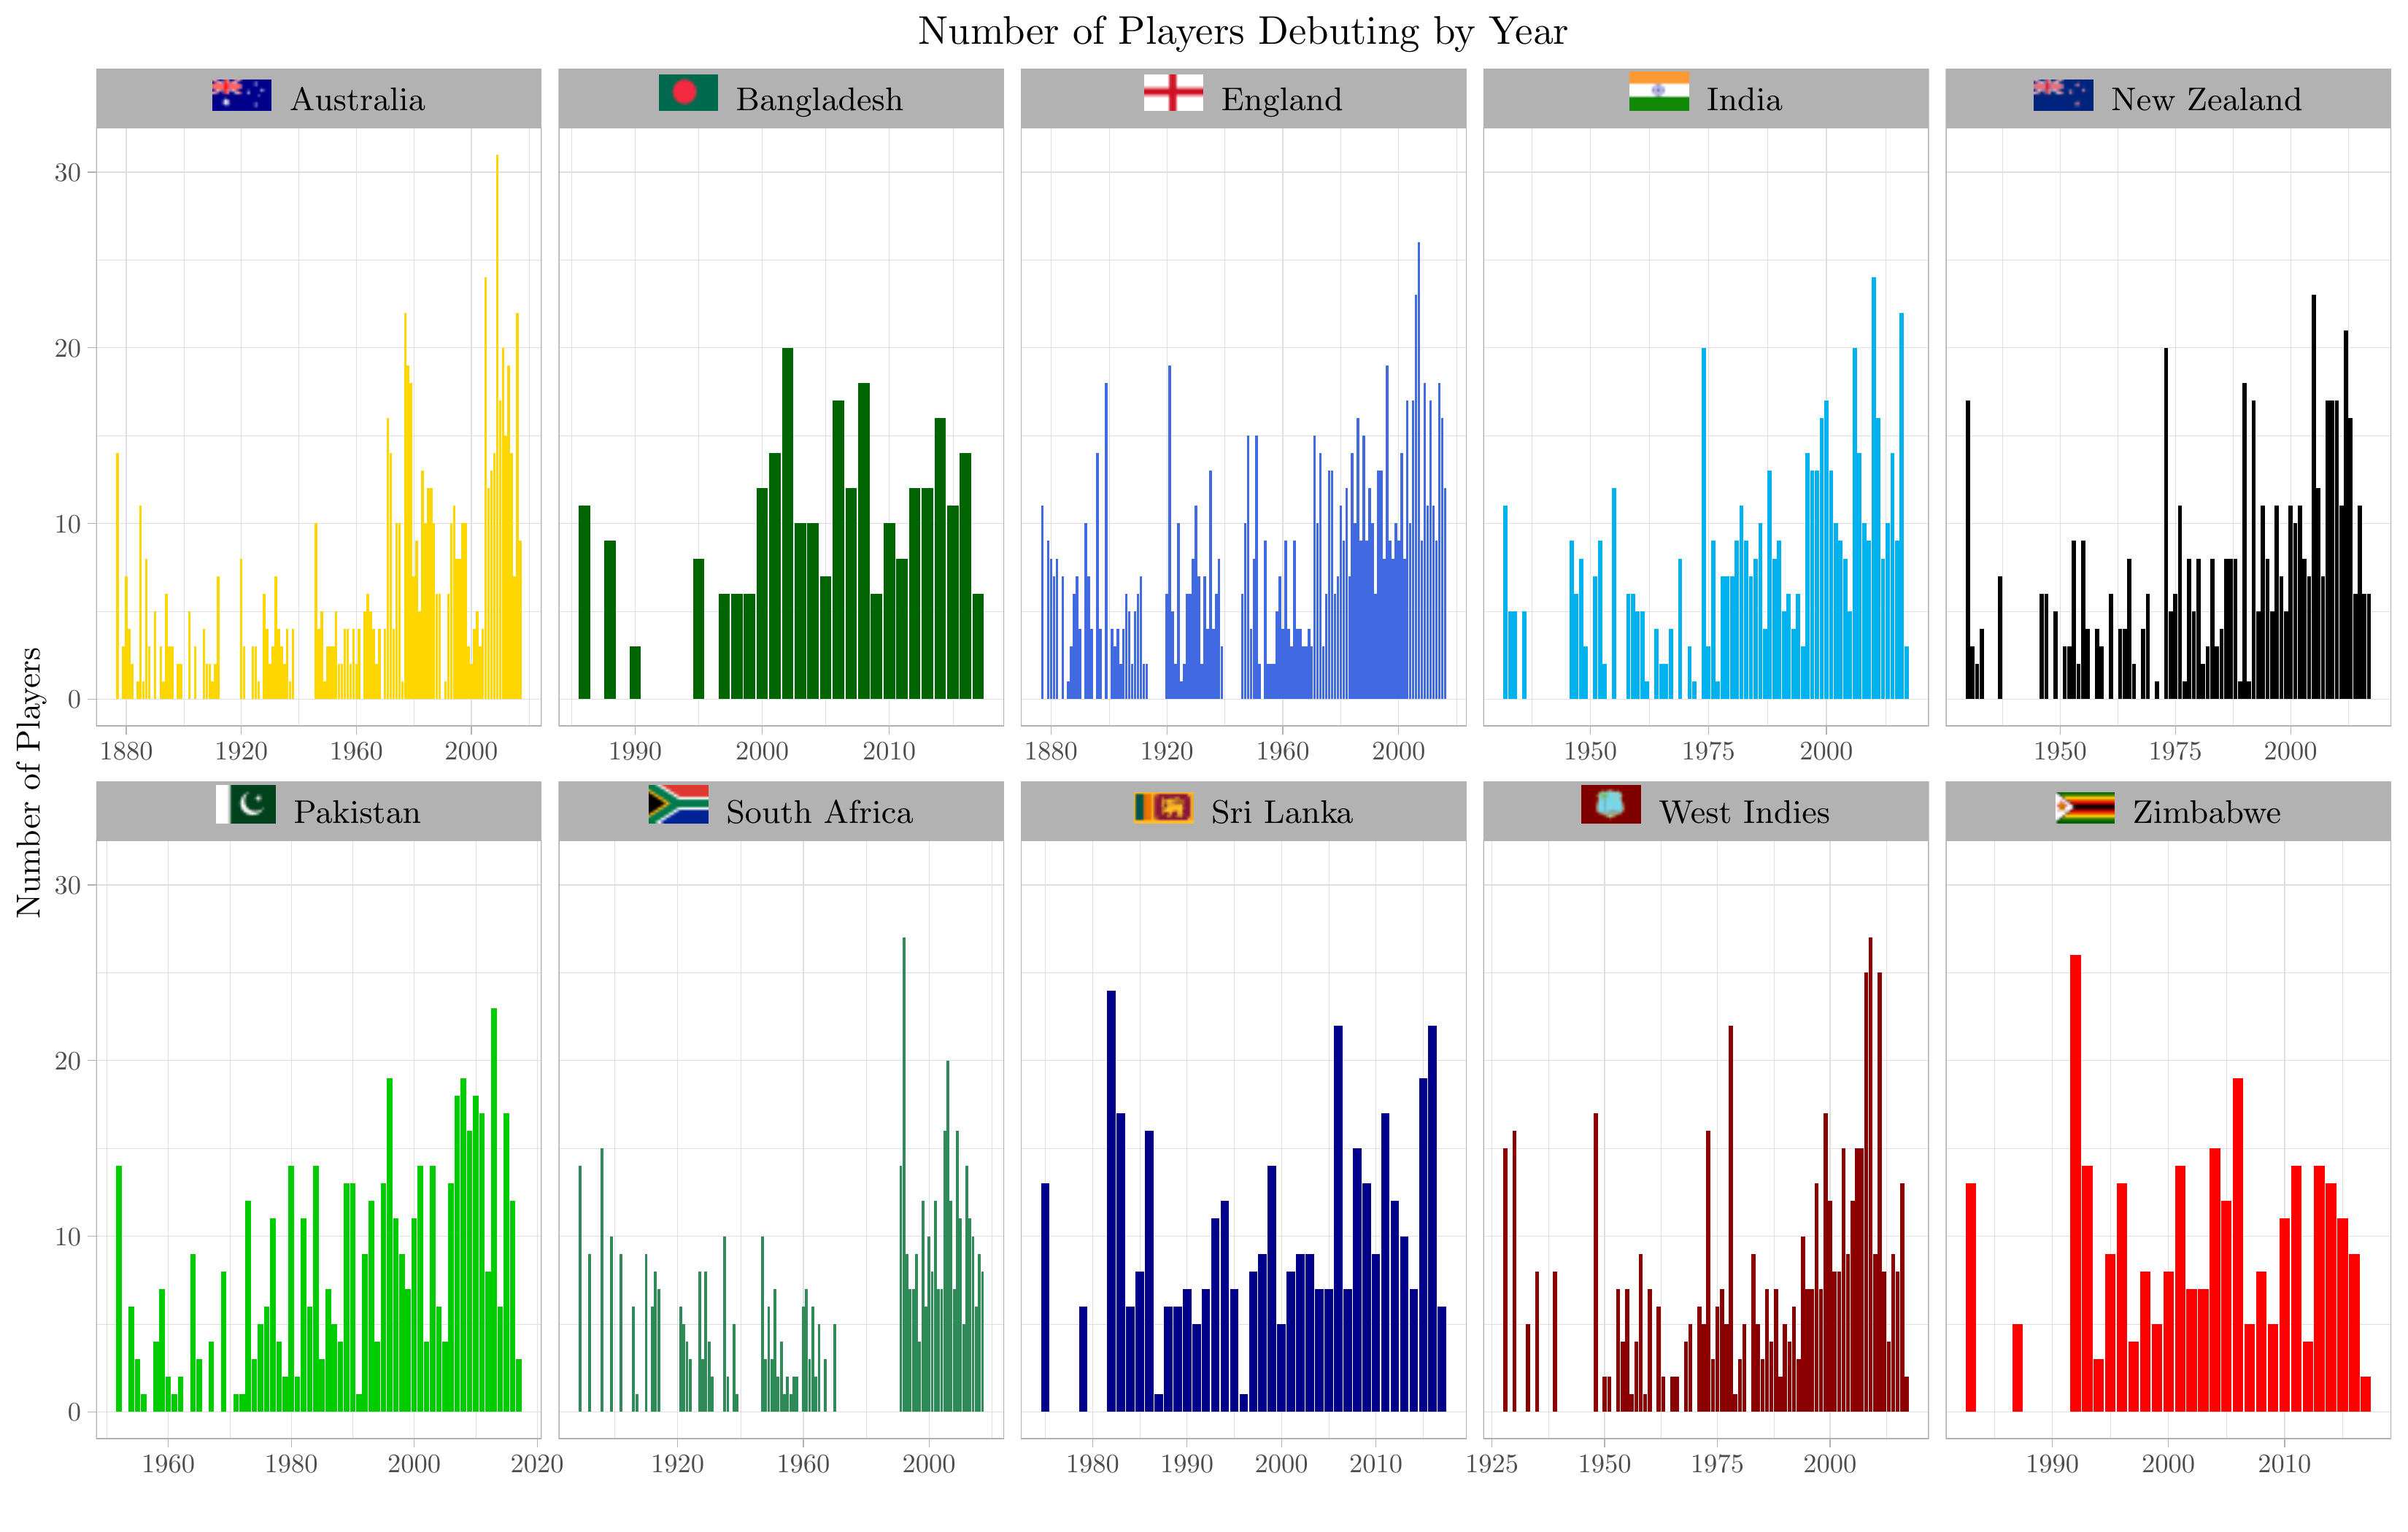
Number of players who debuted internationally by year
This plot shows the number of distinct players debuting each year. So, for instance, if a player debuted in Tests, ODIs and T20Is team in the same year, then that is counted as 1. Few things could be noted here:
- The gaps in Australia, England and India facets show the years interrupted by the 2 world wars.
- As noted earlier, there’s a big gap in the South Africa facet, when the country was suspended from 1970-1991.
- The gaps in Bangladesh, Sri Lanka and Zimbabwe are because each country was an associate member of the ICC and was only competing in ICC ODI tournaments until the country got its full member status.
- There’s been a steady increase in the number of players debuting in Australia, England, India, Pakistan and West Indies, in the last decade or so. This suggests a trend of having specialist players in the team for each format. Top teams like Australia, England and India have adopted this trend. Some players are selected as Test match specialists, while the others are selected to only play in ODIs and T20Is.
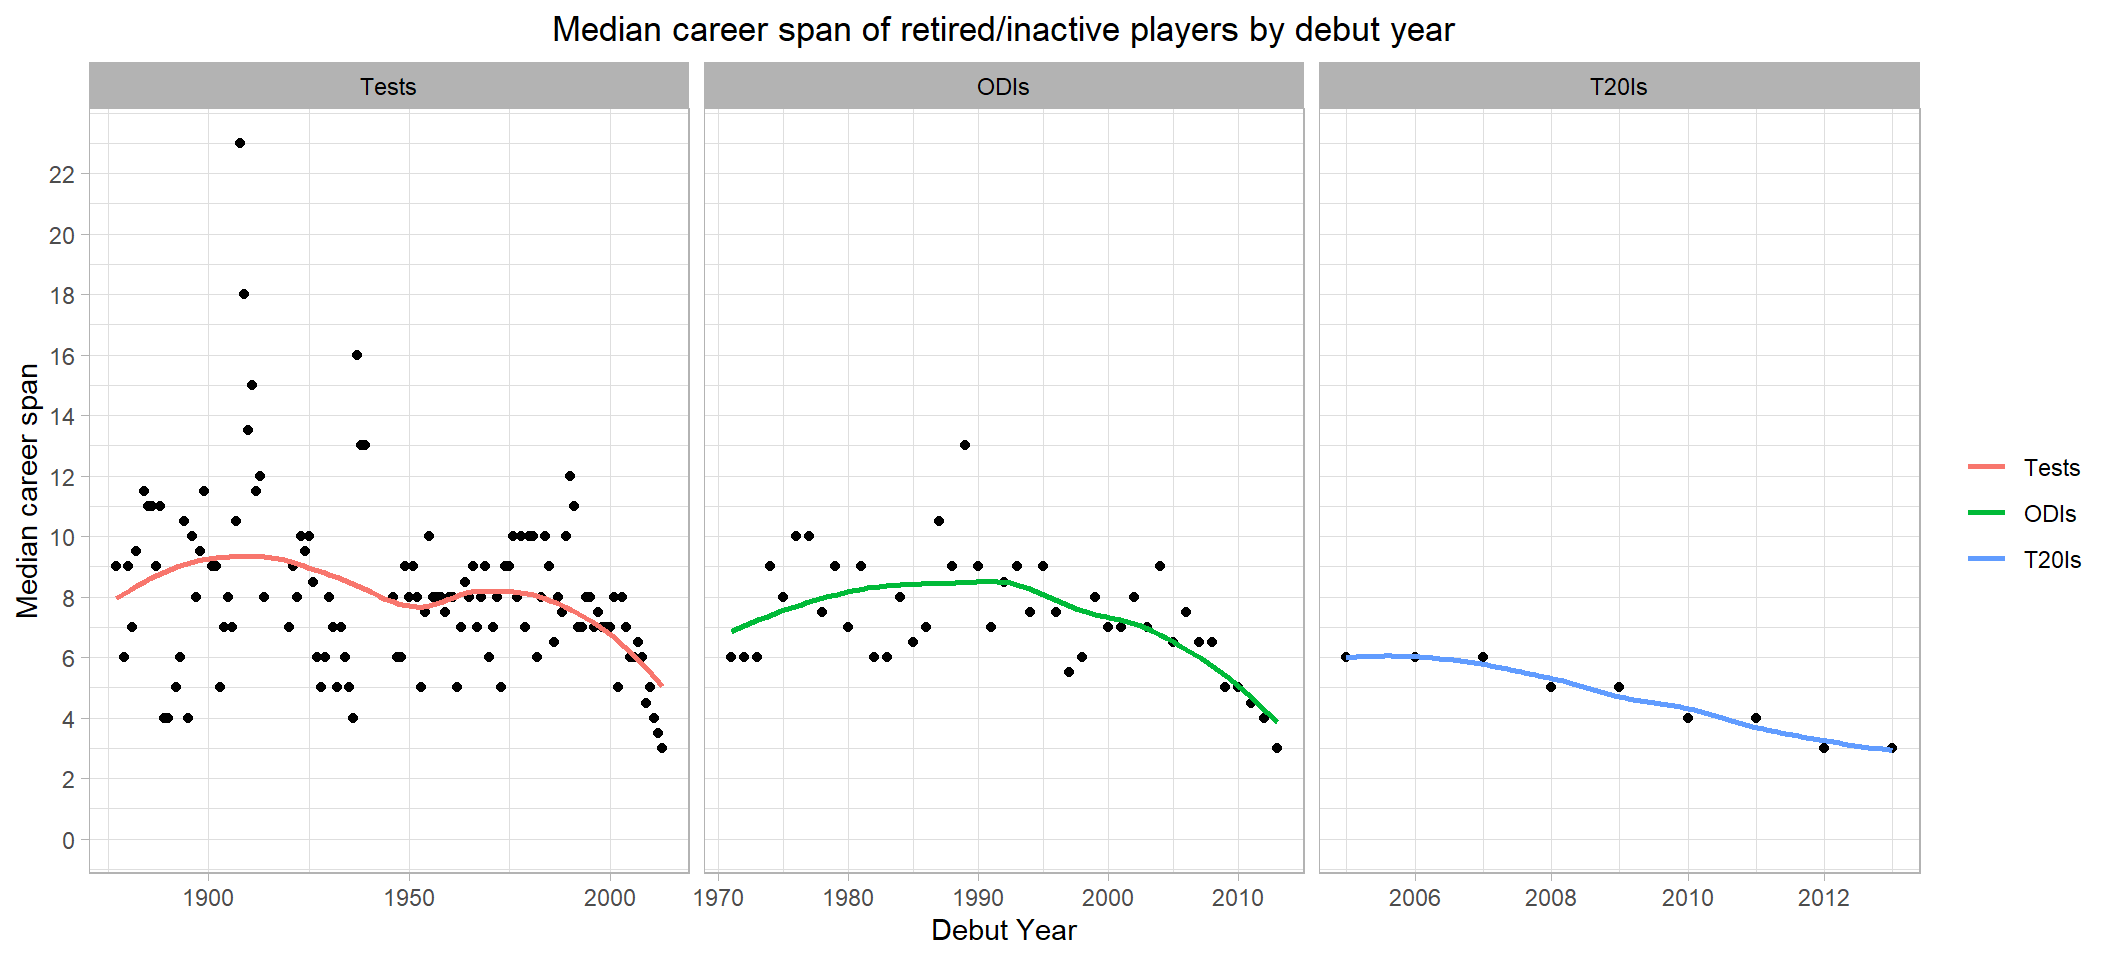
Career spans of players
To examine the career spans of players, I filtered the dataset to only keep the players who haven’t been active in 2016-2017. Then I eliminated quick failures whose career didn’t last for more than 2 years. This meant the players left in the dataset were given enough opportunities to succeed at the international level. Then I examined the median career span by debut year.
It appears a median player used to play between 6 to 10 years before retiring. Although there was more dispersion in Tests, it was clearly the norm in ODIs. 1908 was an extreme outlier year in Tests because only 1 player qualified the inclusion criteria. This was Sir Jack Hobbs of England, an early master of the game who played for 23 years. 1909 was another extreme outlier year where only 3 players were included. These were the legends Warren Bardsley of Australia (18 years), Frank Woolley of England (26 years) and Bill Whitty of Australia (4 years).
An outlier in the ODIs plot corresponds to the year 1989. This was the year when some modern day legends made their debut. Most notably Sachin Tendulkar from India who played for 24 years. Saeed Anwar, Waqar Younis & Mushtaq Ahmed from Pakistan who each played for 15 years and Sanath Jayasuriya from Sri Lanka who played for 23 years. Alec Stewart and Nasser Hussain from England also debuted in 1989. They had checkered records in ODIs but overall their careers lasted for 15 years.
An astonishing trend appears to have started with the players debuting after the early 90s. Career spans of players peaked with those debuting during early 90s. Since then the median career span started dropping year by year. This could be seen across all formats. Although the median career span would change for more recent years as active players playing from early 2000s retire in future, nevertheless this trend is persistent from early 90s.
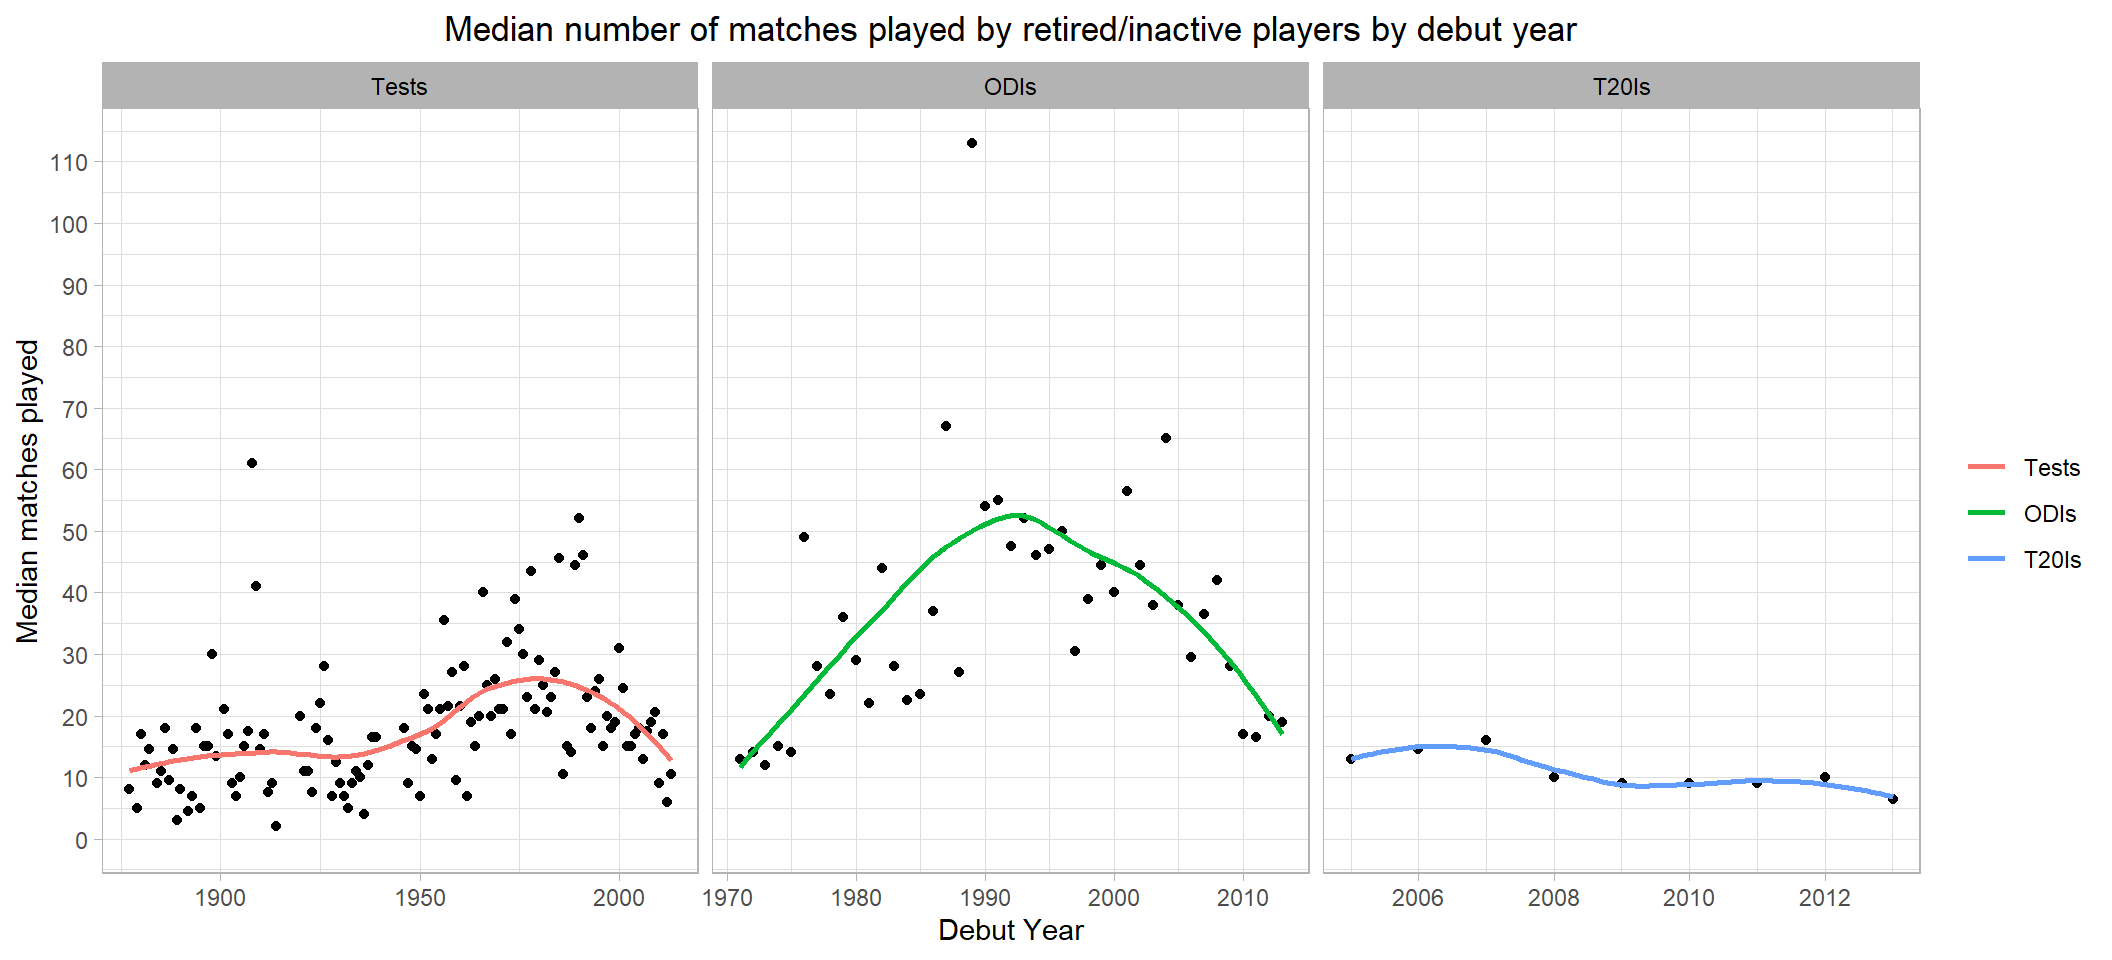
Matches played by debut years
The same downwards trends from early 90s could also be observed in the median number of matches played by debut year. This isn’t surprising as the number of matches played is directly correlated with career span. An upward trend from early 30s could be observed in Test matches played. This is explained by the addition of West Indies, New Zealand and India as full members of the ICC from late 20s. Every international player started playing more matches as the number of competing teams doubled to 6.
A big upward trend could be seen in ODIs from its inception. Until the beginning of ODIs, cricket was only played in Tests format that was characteristically very laid back. Both teams got a chance to bat upto 2 innings alternately over 5 days. More often than not the matches would end in a draw with no win/loss result. The introduction of 60 overs a side ODIs (later reduced to 50 overs a side) format was to be played in a single day. The team batting first would set a target score. Then the team batting second would chase this target. This ensured guaranteed results although there have been few occasions where the ODIs have resulted in ties at the same score. Naturally this format was more palatable to spectators and TV audiences that contributed to a rapid growth in its popularity. The ODIs format is still the most popular format till date.
In the next couple of posts I will analyze batting performances.