Ames Housing - Part 1 - Exploratory Data Analysis
In this case study, we will use the Ames Housing dataset to explore regression techniques and predict the sale price of houses.
Data Summaries
The Ames Housing dataset contains the sale prices of properties in Ames, Iowa along with 80 other features. Each property has an Id associated with it. Here are the dimensions of the training and testing sets respectively:
[1] "Dimensions of the training set"[1] 1460 81[1] "Dimensions of the testing set"[1] 1459 81Now, let’s combine training and testing into a single dataset and take a look at the count of missing values:
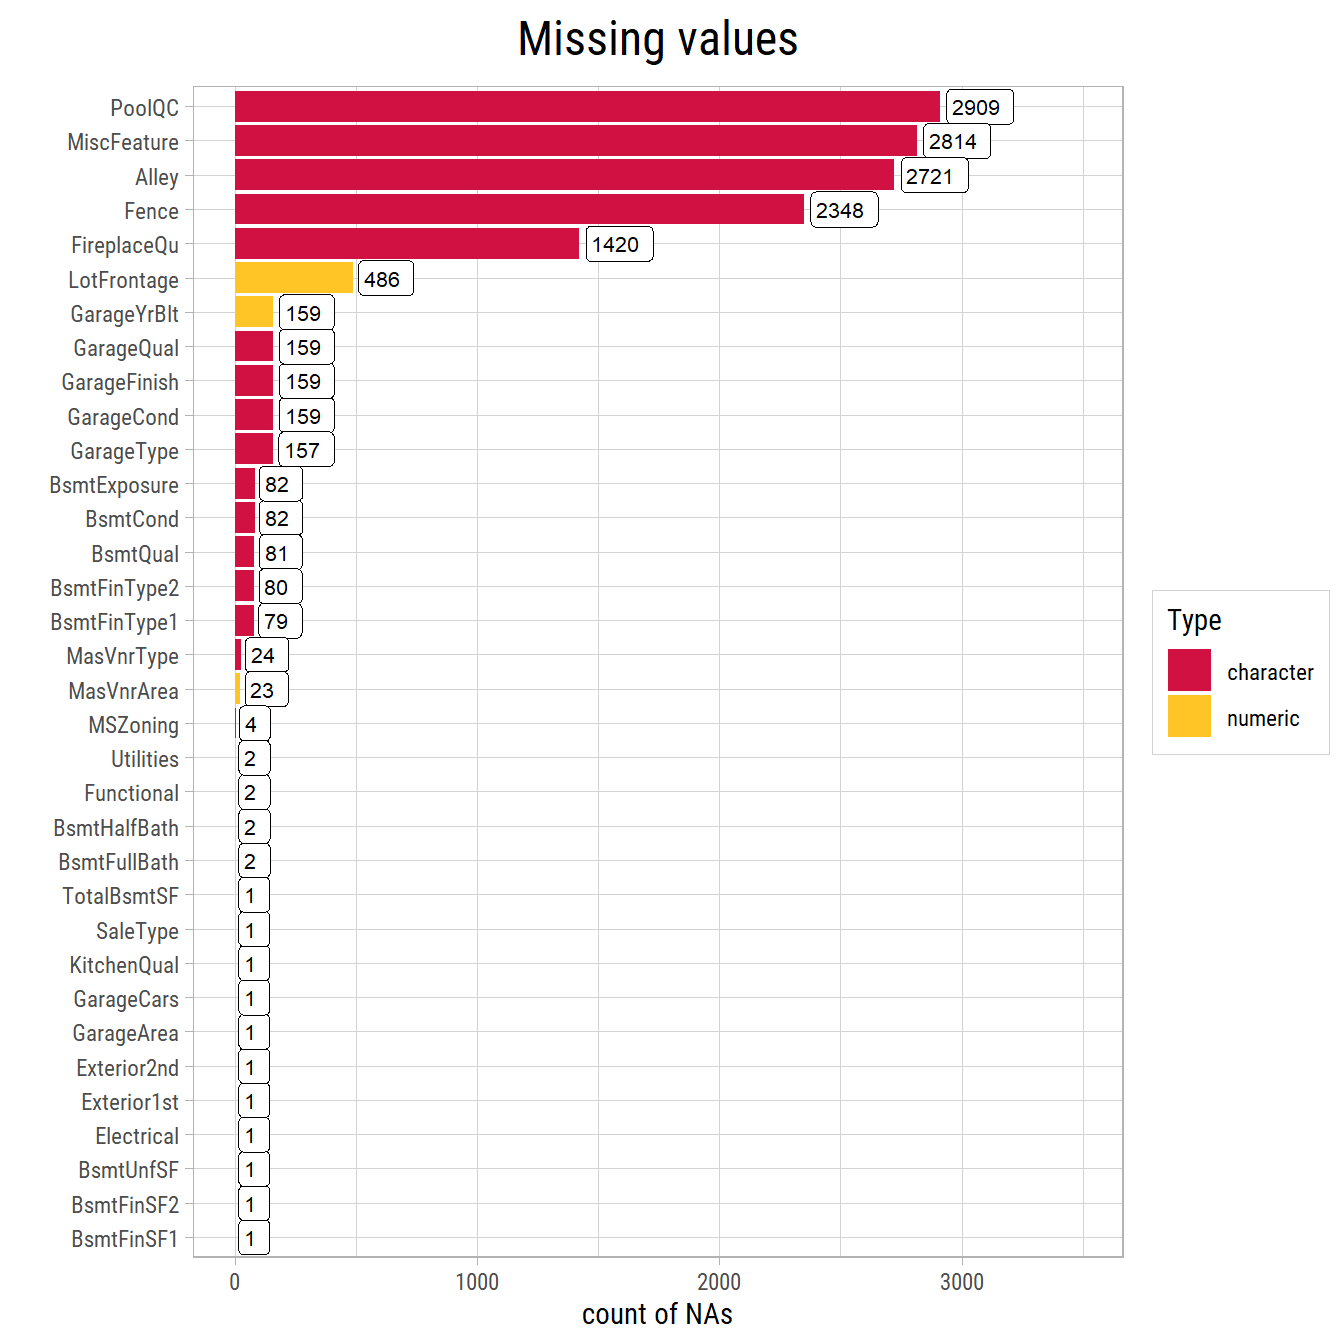
What’s notable?
- The combined dataset has 2919 property records.
- Very few properties have a pool, fence or an alley access to the property.
- Very few properties have a miscellaneous feature that has not been covered by other features.
- More than a dozen features have atleast 1 missing value. Since we have a tiny dataset, we will try to impute the missing values.
Data Cleaning & Transformation
We will visualize features of the complete dataset and create a data cleaning pipeline.
Fixing Data Errors
First, a few data integrity checks need to be done to ensure the quality of the data:
YearRemodAddshould not be earlier thanYearBuilt: 1 record to be fixedYrSoldshould not be earlier thanYearRemodAdd: 3 records to be fixed
# A tibble: 1 x 4
     Id YearBuilt YearRemodAdd YrSold
  <dbl>     <dbl>        <dbl>  <dbl>
1  1877      2002         2001   2009
# A tibble: 3 x 4
Id YearBuilt YearRemodAdd YrSold
<dbl> <dbl> <dbl> <dbl>
1 524 2007 2008 2007
2 2296 2007 2008 2007
3 2550 2008 2009 2007GarageYrBltshould not be earlier thanYearBuilt: 18 records to be fixedGarageYrBltshould not be later thanYrSold: 1 record to be fixed
# A tibble: 18 x 4
      Id YearBuilt GarageYrBlt YrSold
   <dbl>     <dbl>       <dbl>  <dbl>
 1    30      1927        1920   2008
 2    94      1910        1900   2007
 3   325      1967        1961   2010
 4   601      2005        2003   2006
 5   737      1950        1949   2006
 6  1104      1959        1954   2006
 7  1377      1930        1925   2008
 8  1415      1923        1922   2008
 9  1419      1963        1962   2008
10  1522      1959        1956   2010
11  1577      2010        2009   2010
12  1806      1935        1920   2009
13  1841      1978        1960   2009
14  1896      1941        1940   2009
15  1898      1935        1926   2009
16  2123      1945        1925   2008
17  2264      2006        2005   2007
18  2510      2006        2005   2007
# A tibble: 1 x 4
Id YearBuilt GarageYrBlt YrSold
<dbl> <dbl> <dbl> <dbl>
1 2593 2006 2207 2007Imputing Missing Values & New Features
Basement Features
There is one property (
Id= 2121) where all the basement features are NA.TotalBsmtSFis replaced by 0.Now there are 79 properties which have no basement (
TotalBsmtSF= 0). All other basement features having NA values are changed to None.Since qualitative features do not have the same distribution across neighborhoods, any remaining NA values are imputed to be the most common value in that
Neighborhood.
# A tibble: 1 x 13
     Id Neighborhood BsmtQual BsmtCond BsmtExposure BsmtFinType1 BsmtFinSF1 BsmtFinType2 BsmtFinSF2 BsmtUnfSF TotalBsmtSF BsmtFullBath BsmtHalfBath
  <dbl> <chr>        <chr>    <chr>    <chr>        <chr>             <dbl> <chr>             <dbl>     <dbl>       <dbl>        <dbl>        <dbl>
1  2121 BrkSide      <NA>     <NA>     <NA>         <NA>                 NA <NA>                 NA        NA          NA           NA           NA
# A tibble: 79 x 13
Id Neighborhood BsmtQual BsmtCond BsmtExposure BsmtFinType1 BsmtFinSF1 BsmtFinType2 BsmtFinSF2 BsmtUnfSF TotalBsmtSF BsmtFullBath BsmtHalfBath
<dbl> <chr> <chr> <chr> <chr> <chr> <dbl> <chr> <dbl> <dbl> <dbl> <dbl> <dbl>
1 18 Sawyer <NA> <NA> <NA> <NA> 0 <NA> 0 0 0 0 0
2 40 Edwards <NA> <NA> <NA> <NA> 0 <NA> 0 0 0 0 0
3 91 NAmes <NA> <NA> <NA> <NA> 0 <NA> 0 0 0 0 0
4 103 SawyerW <NA> <NA> <NA> <NA> 0 <NA> 0 0 0 0 0
5 157 NAmes <NA> <NA> <NA> <NA> 0 <NA> 0 0 0 0 0
6 183 Edwards <NA> <NA> <NA> <NA> 0 <NA> 0 0 0 0 0
7 260 OldTown <NA> <NA> <NA> <NA> 0 <NA> 0 0 0 0 0
8 343 NAmes <NA> <NA> <NA> <NA> 0 <NA> 0 0 0 0 0
9 363 Edwards <NA> <NA> <NA> <NA> 0 <NA> 0 0 0 0 0
10 372 ClearCr <NA> <NA> <NA> <NA> 0 <NA> 0 0 0 0 0
# ... with 69 more rows# A tibble: 9 x 13
Id Neighborhood BsmtQual BsmtCond BsmtExposure BsmtFinType1 BsmtFinSF1 BsmtFinType2 BsmtFinSF2 BsmtUnfSF TotalBsmtSF BsmtFullBath BsmtHalfBath
<dbl> <chr> <chr> <chr> <chr> <chr> <dbl> <chr> <dbl> <dbl> <dbl> <dbl> <dbl>
1 333 NridgHt Gd TA No GLQ 1124 <NA> 479 1603 3206 1 0
2 949 CollgCr Gd TA <NA> Unf 0 Unf 0 936 936 0 0
3 1488 Somerst Gd TA <NA> Unf 0 Unf 0 1595 1595 0 0
4 2041 Veenker Gd <NA> Mn GLQ 1044 Rec 382 0 1426 1 0
5 2186 Edwards TA <NA> No BLQ 1033 Unf 0 94 1127 0 1
6 2218 IDOTRR <NA> Fa No Unf 0 Unf 0 173 173 0 0
7 2219 IDOTRR <NA> TA No Unf 0 Unf 0 356 356 0 0
8 2349 Somerst Gd TA <NA> Unf 0 Unf 0 725 725 0 0
9 2525 CollgCr TA <NA> Av ALQ 755 Unf 0 240 995 0 0Histograms of numerical basement features and their correlations with SalePrice are plotted below.
It could be verified that: TotalBsmtSF = BsmtFinSF1 + BsmtFinSF2 + BsmtUnfSF
Additionally, new features are generated where:
BsmtBath=BsmtFullBath+ 0.5 *BsmtHalfBathHasBsmt=TotalBsmtSF> 0
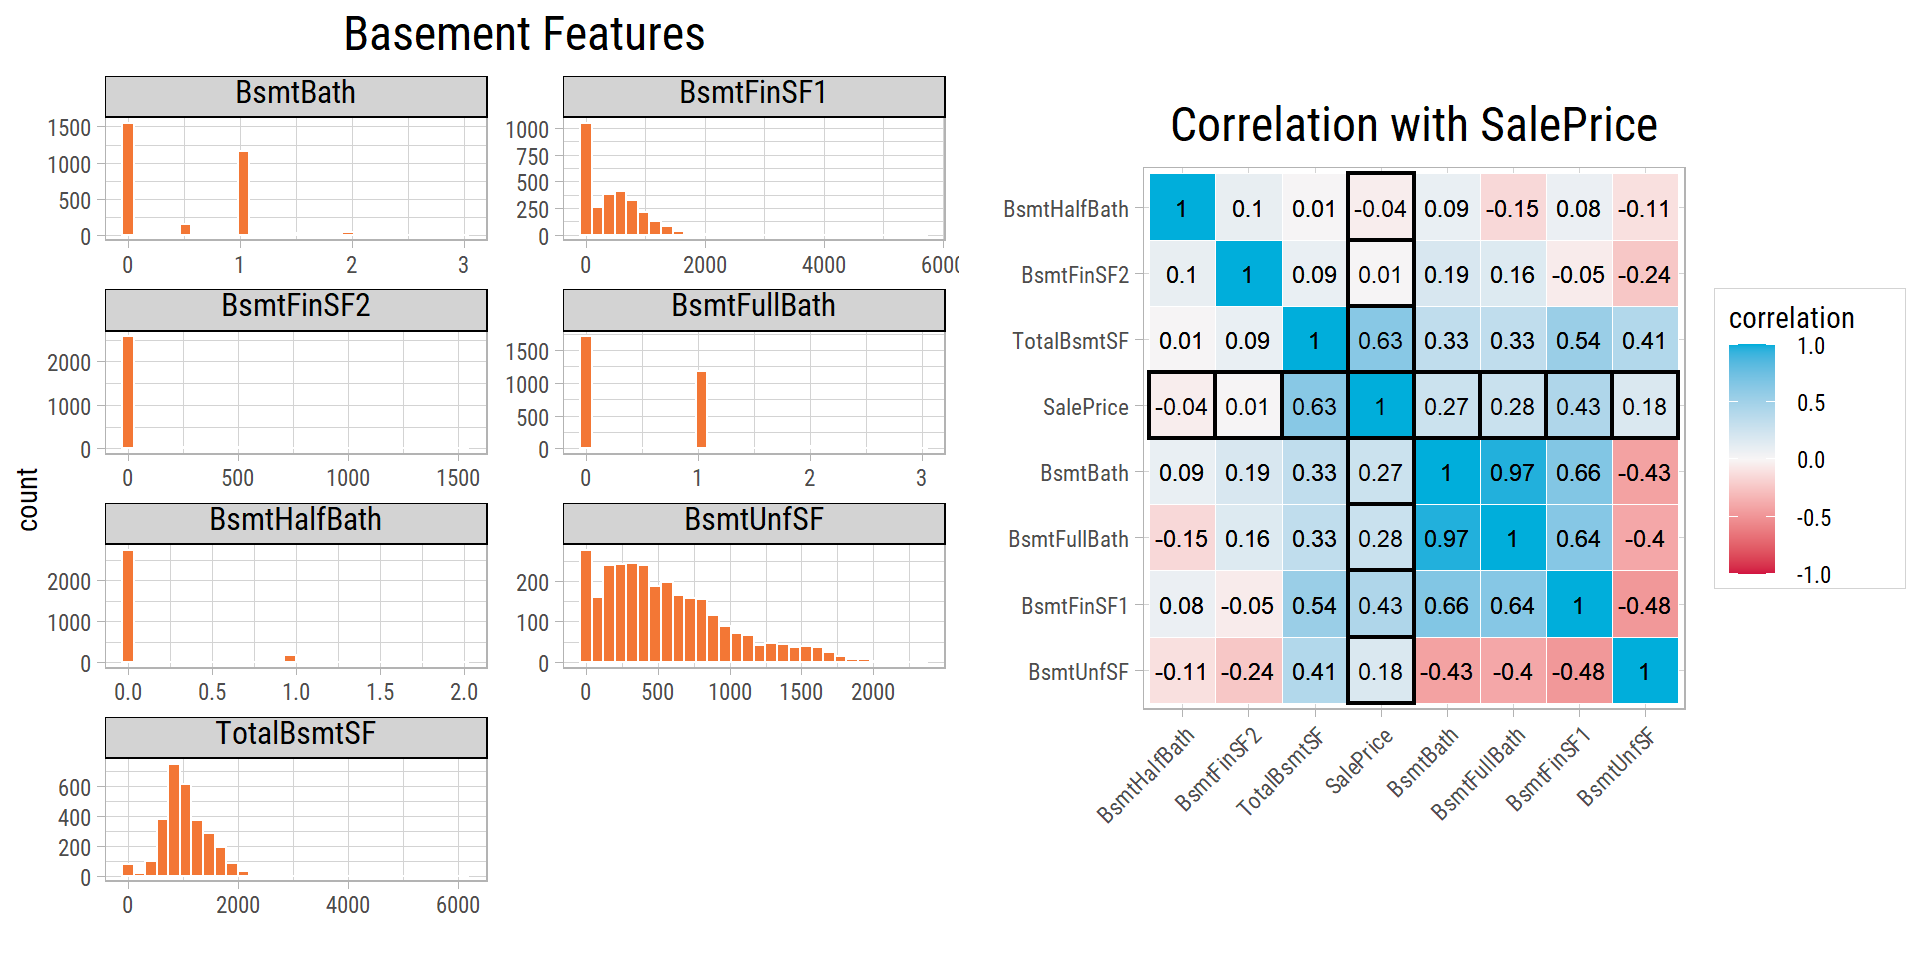
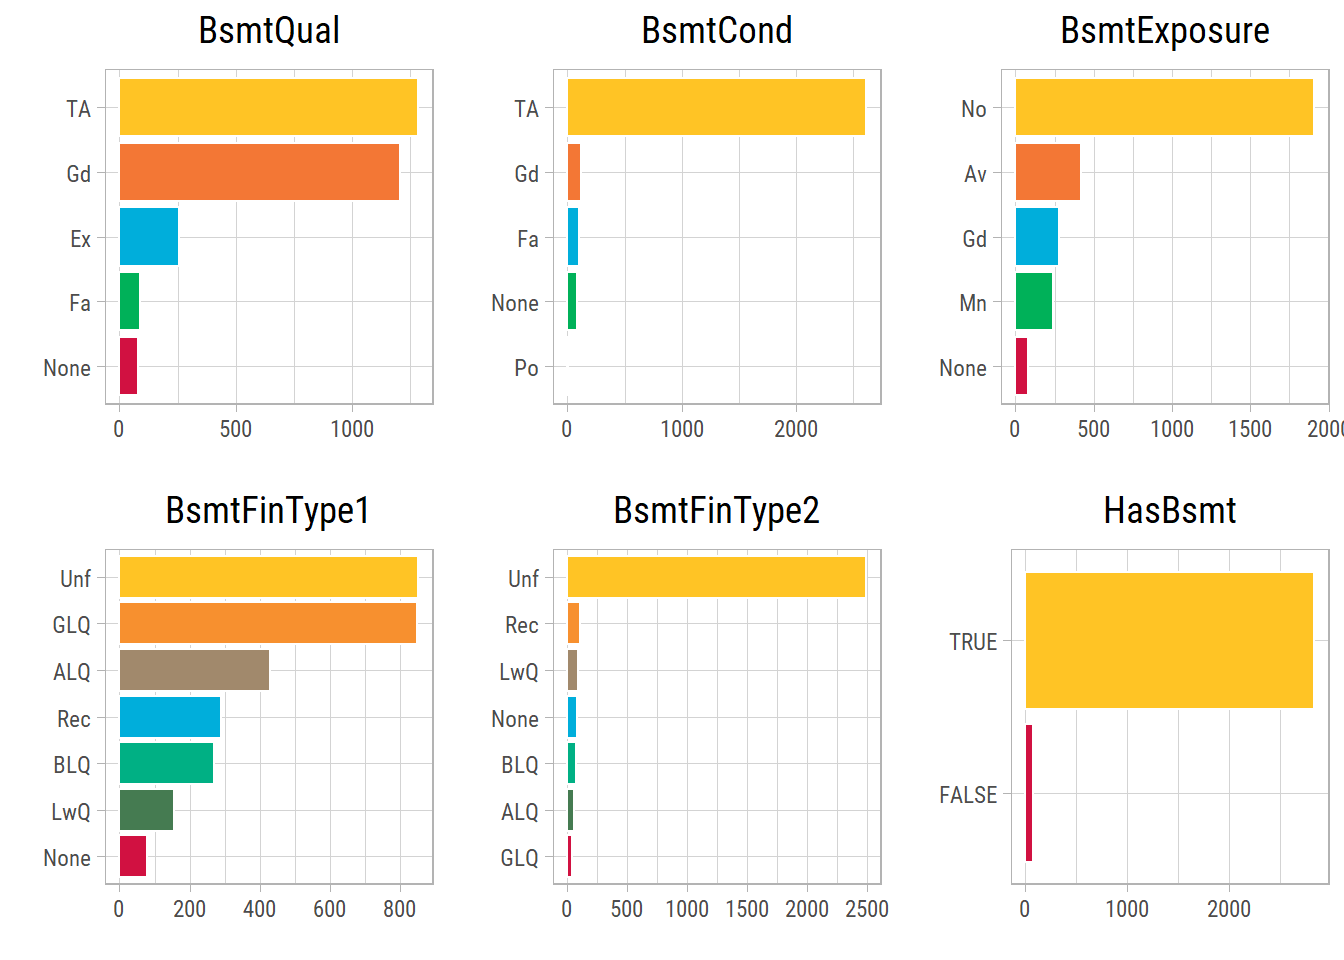
- Most properties have a basement.
- Column plots show that
BsmtFinType2andBsmtCondvalues are dominated by a single category.
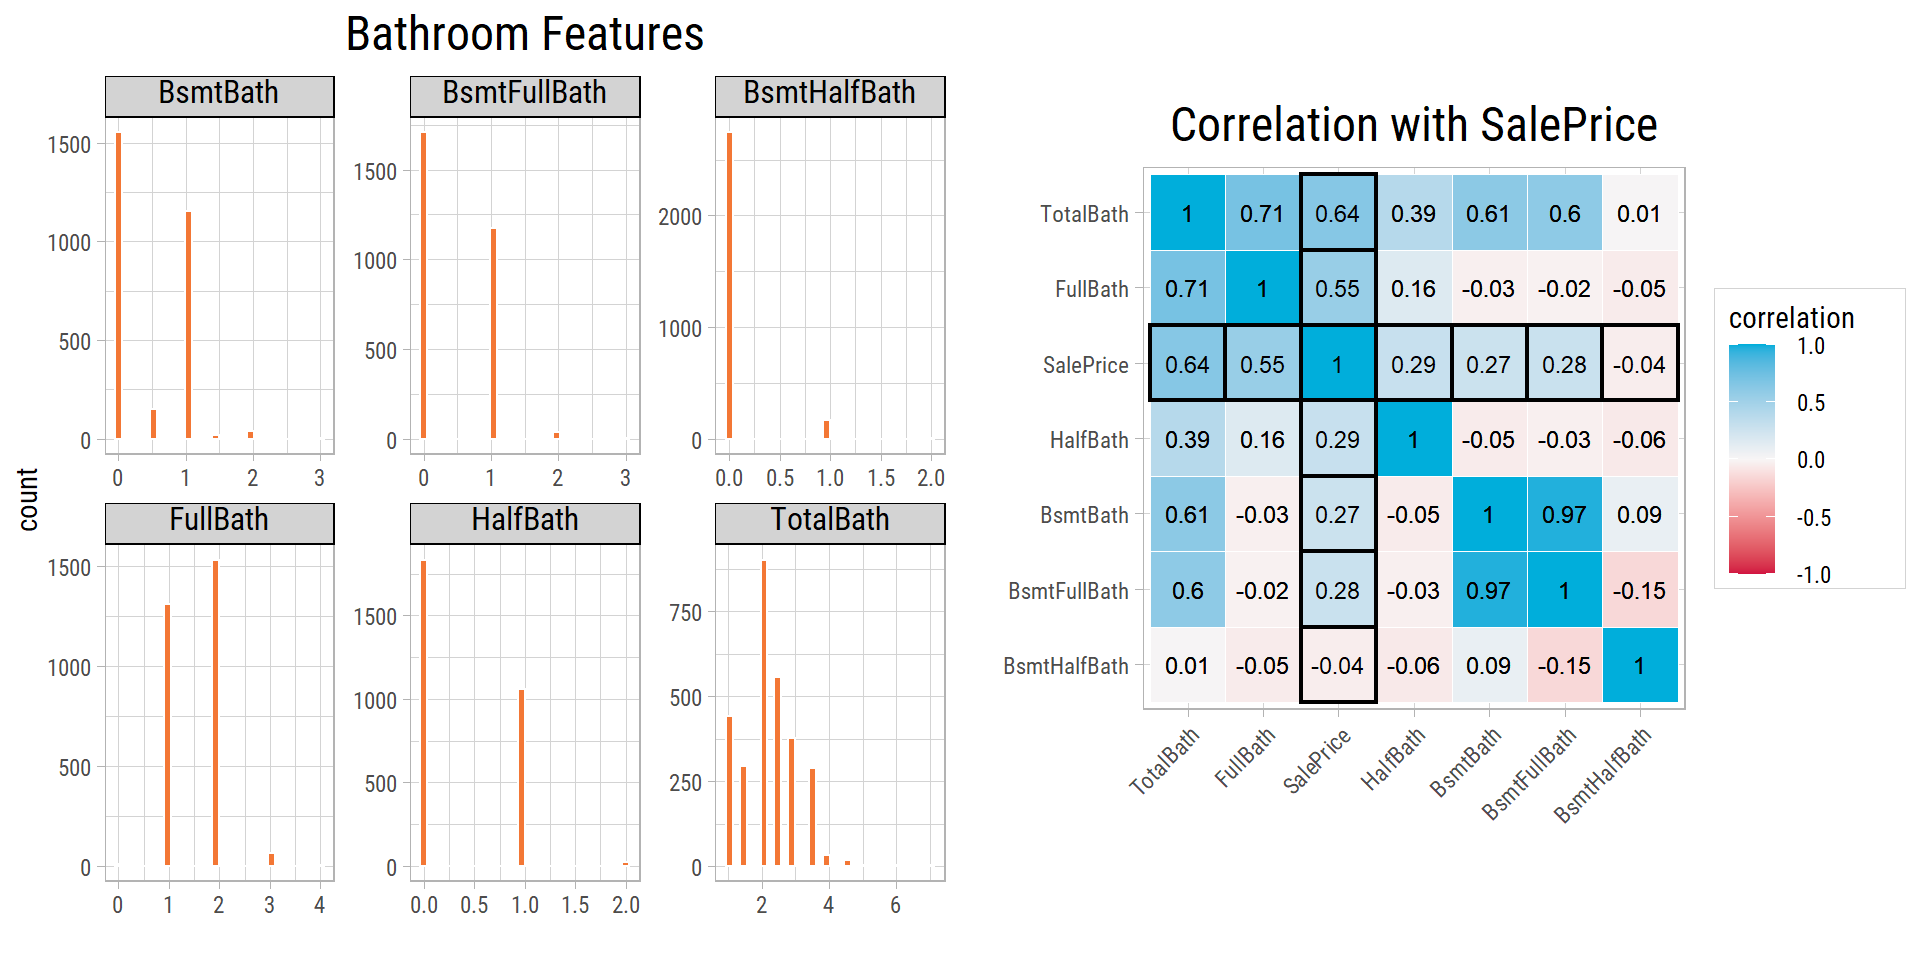
Bathroom Features
- A new feature is generated to determine the total number of bathrooms:
TotalBath=FullBath+HalfBath+BsmtBath
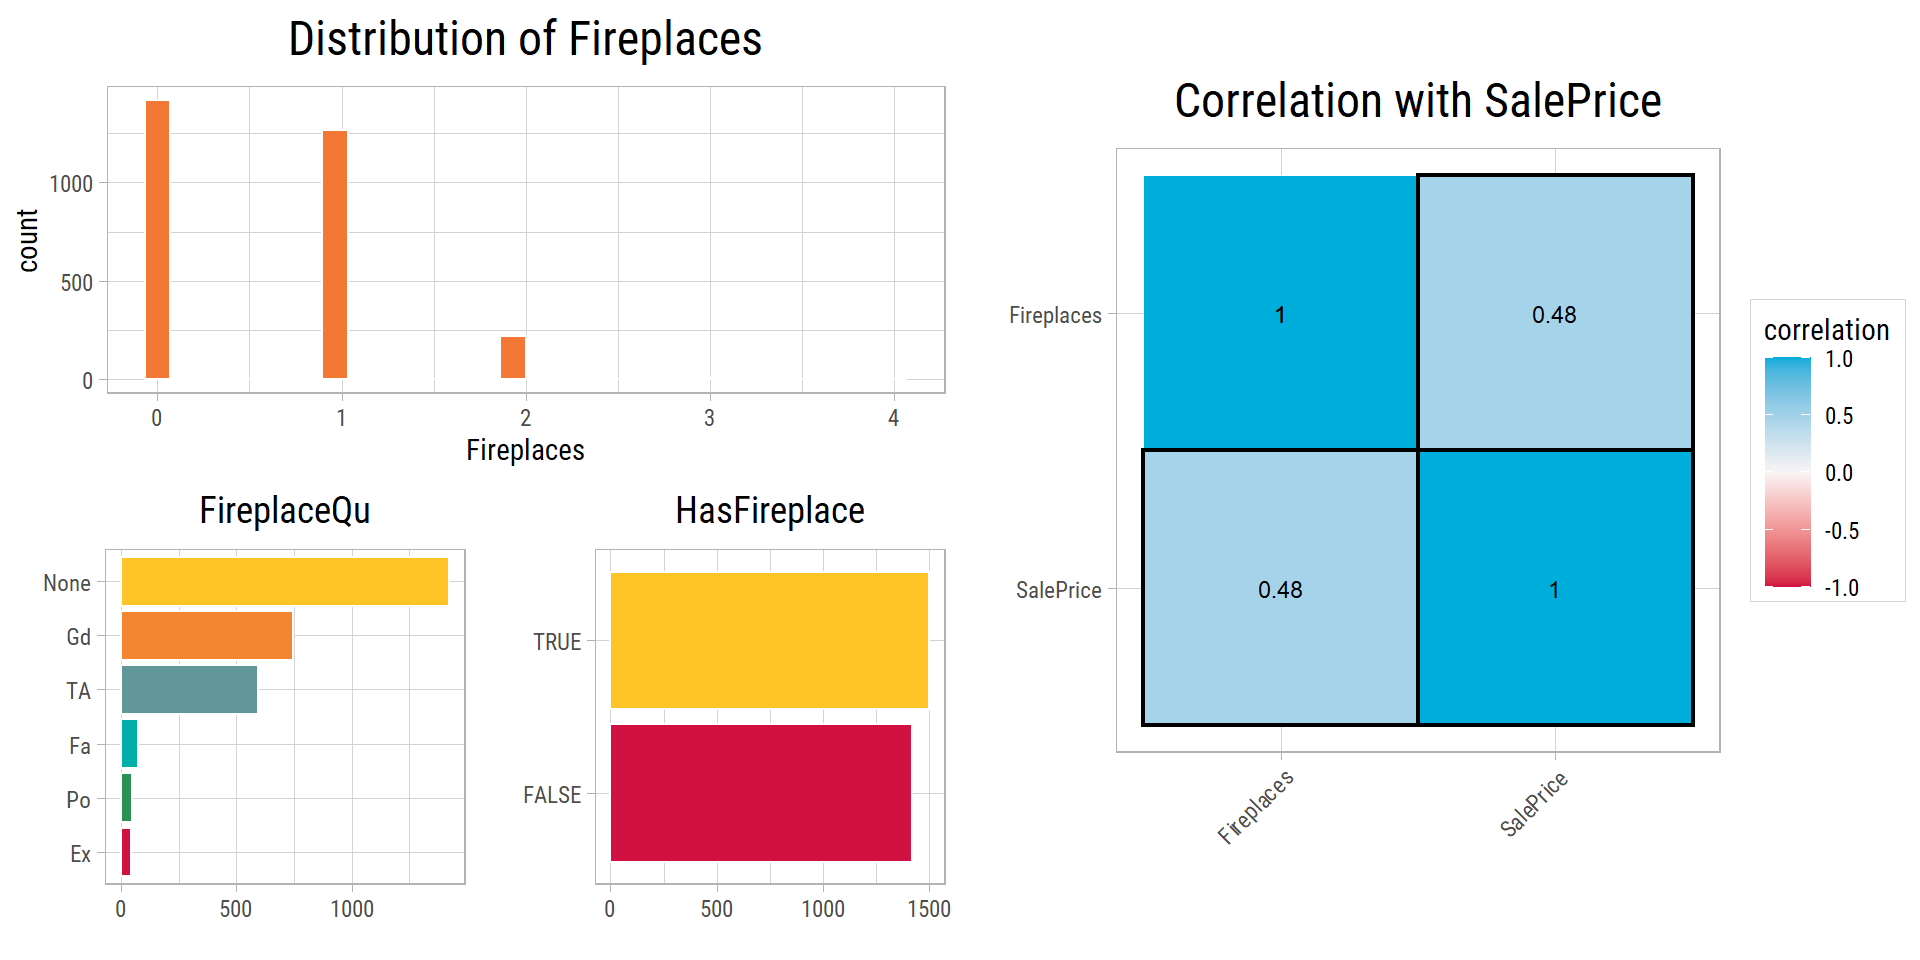
Fireplace Features
- There are 1420 properties that have no fireplaces.
FireplaceQuis changed to None.
# A tibble: 1,420 x 4
      Id Neighborhood Fireplaces FireplaceQu
   <dbl> <chr>             <dbl> <chr>
 1     1 CollgCr               0 <NA>
 2     6 Mitchel               0 <NA>
 3    11 Sawyer                0 <NA>
 4    13 Sawyer                0 <NA>
 5    16 BrkSide               0 <NA>
 6    18 Sawyer                0 <NA>
 7    19 SawyerW               0 <NA>
 8    20 NAmes                 0 <NA>
 9    27 NAmes                 0 <NA>
10    30 BrkSide               0 <NA>
# ... with 1,410 more rows- A new feature is generated where:
HasFireplace=Fireplaces> 0 - A significant number of properties have fireplaces.
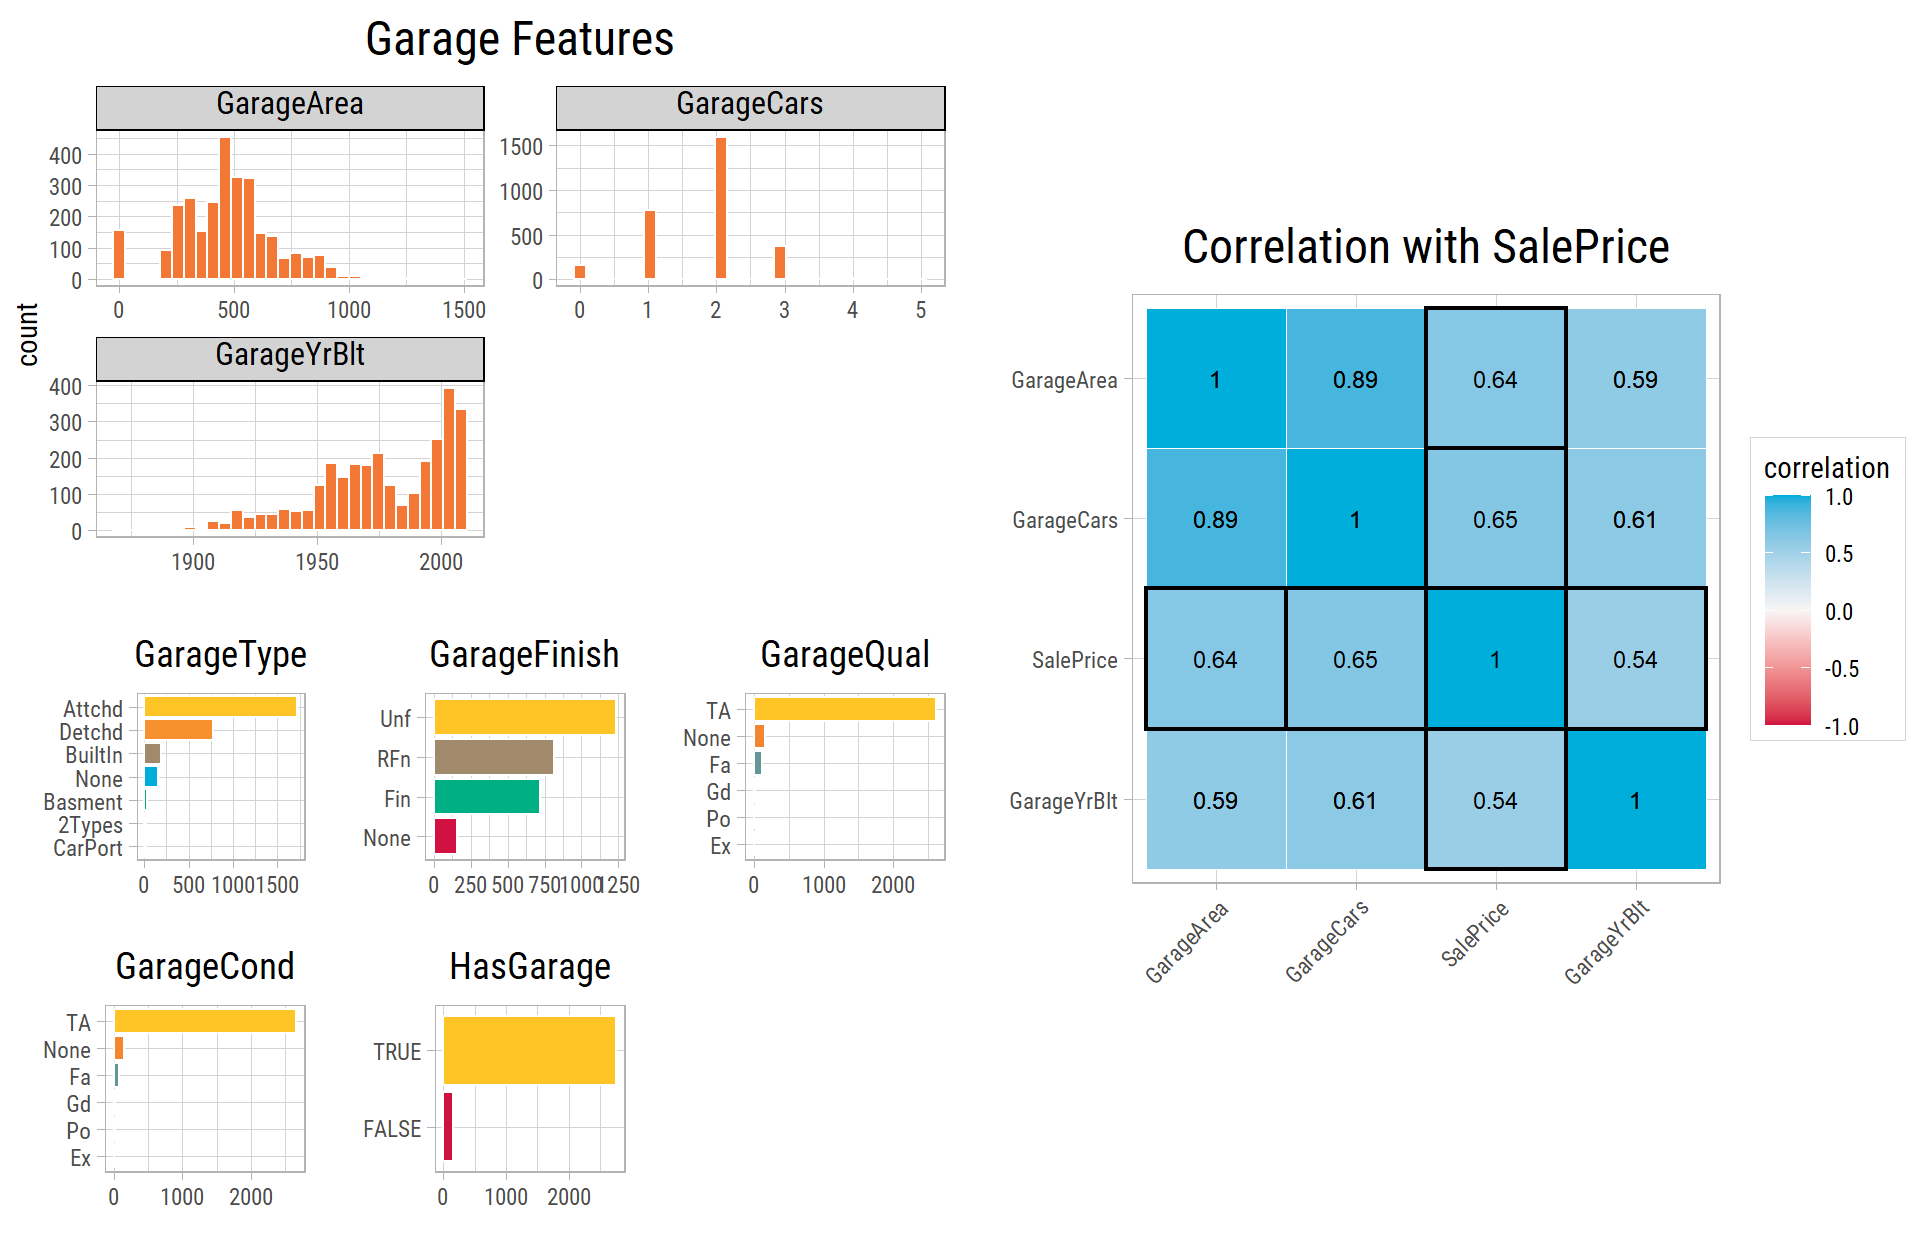
Garage Features
GarageYrBltwhere NA is set toYearBuilt.There are 157 properties where the property has no garage. In these records,
GarageType,GarageFinish,GarageQualandGarageCondare recorded as None.Since qualitative features do not have the same distribution across neighborhoods, any remaining NA values are imputed to be the most common or median value in the
NeighborhoodbyGarageType.
# A tibble: 157 x 9
      Id Neighborhood GarageType GarageYrBlt GarageFinish GarageCars GarageArea GarageQual GarageCond
   <dbl> <chr>        <chr>            <dbl> <chr>             <dbl>      <dbl> <chr>      <chr>
 1    40 Edwards      <NA>              1955 <NA>                  0          0 <NA>       <NA>
 2    49 OldTown      <NA>              1920 <NA>                  0          0 <NA>       <NA>
 3    79 Sawyer       <NA>              1968 <NA>                  0          0 <NA>       <NA>
 4    89 IDOTRR       <NA>              1915 <NA>                  0          0 <NA>       <NA>
 5    90 CollgCr      <NA>              1994 <NA>                  0          0 <NA>       <NA>
 6   100 NAmes        <NA>              1959 <NA>                  0          0 <NA>       <NA>
 7   109 IDOTRR       <NA>              1919 <NA>                  0          0 <NA>       <NA>
 8   126 IDOTRR       <NA>              1935 <NA>                  0          0 <NA>       <NA>
 9   128 OldTown      <NA>              1930 <NA>                  0          0 <NA>       <NA>
10   141 NAmes        <NA>              1971 <NA>                  0          0 <NA>       <NA>
# ... with 147 more rows
# A tibble: 2 x 9
Id Neighborhood GarageType GarageYrBlt GarageFinish GarageCars GarageArea GarageQual GarageCond
<dbl> <chr> <chr> <dbl> <chr> <dbl> <dbl> <chr> <chr>
1 2127 OldTown Detchd 1910 <NA> 1 360 <NA> <NA>
2 2577 IDOTRR Detchd 1923 <NA> NA NA <NA> <NA> GarageAreaandGarageCarshave almost similar correlation withSalePrice.- A new feature is generated where:
HasGarage=GarageArea> 0 - Most properties have a garage.
- Column plots show that
GarageQualandGarageCondvalues are dominated by a single category.
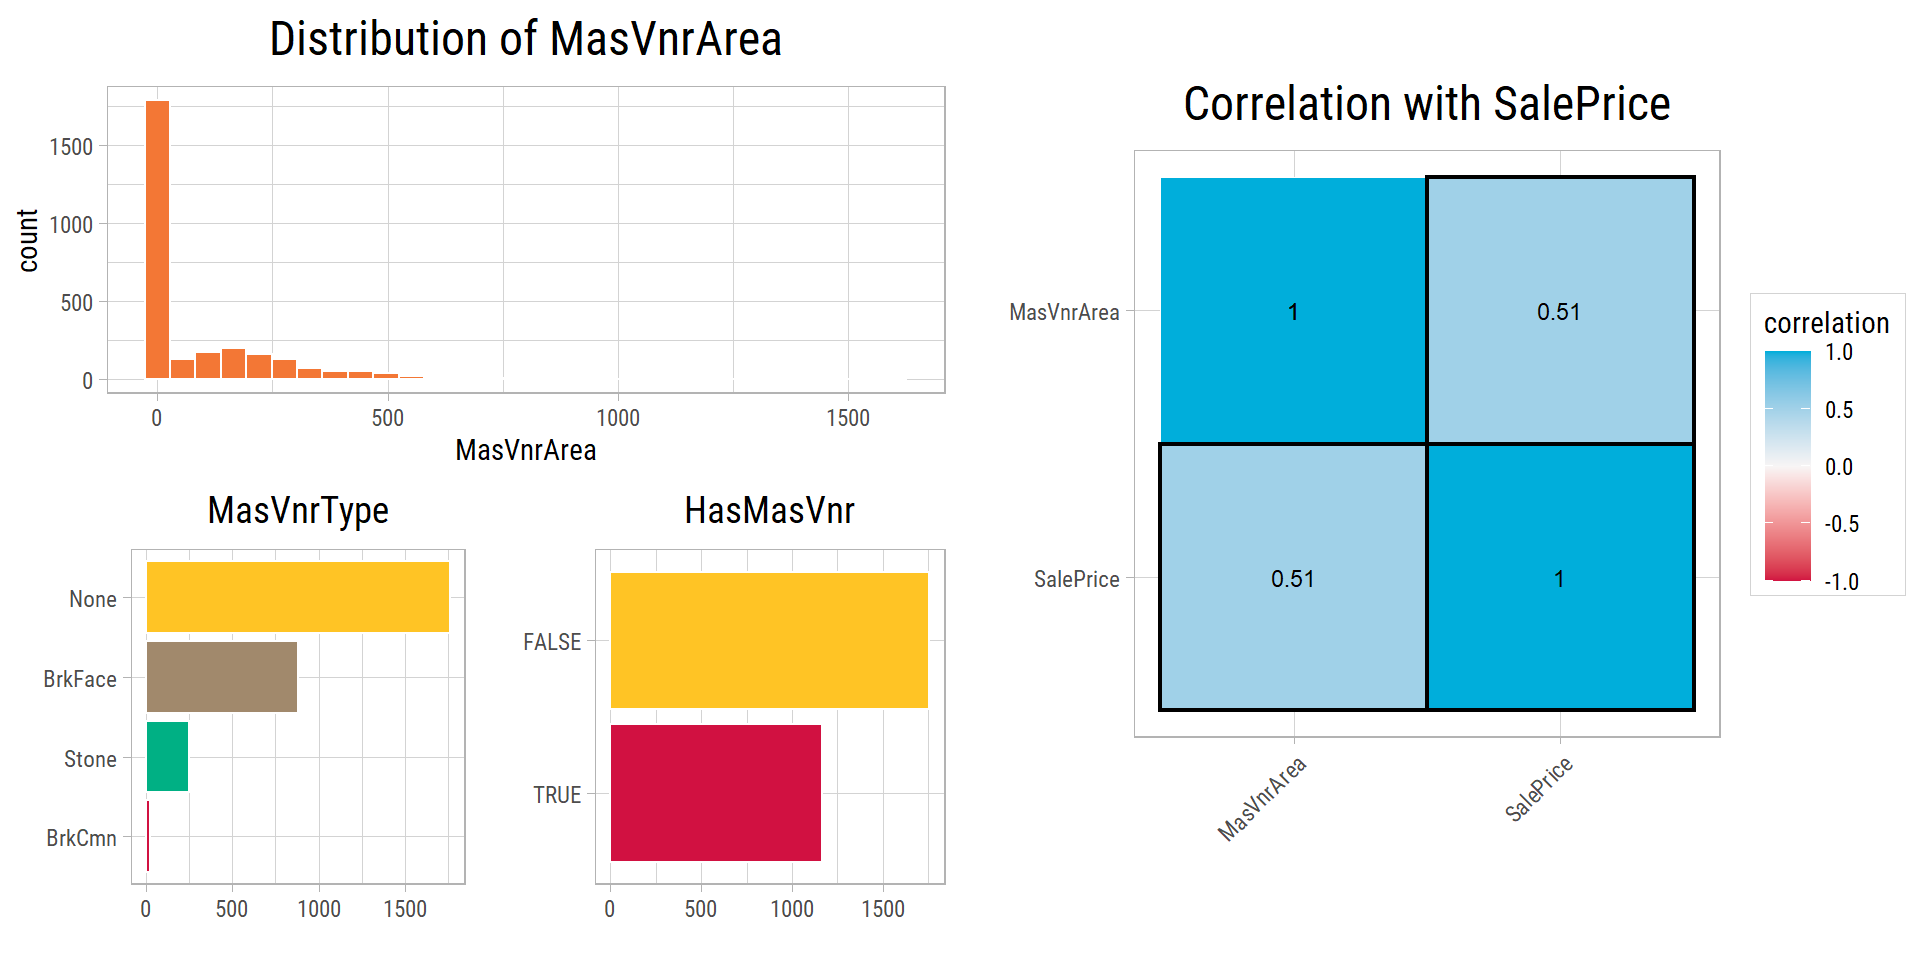
Masonry Features
There is one property (
Id= 2611) whereMasVnrArea= 198 butMasVnrType= NA. ImputeMasVnrTypeto be most common value in the neighborhood whereMasVnrArea> 0.Impute NA values in
MasVnrTypeto be the most common values byNeighborhoodandYearRemodAdd.Impute NA values in
MasVnrAreato be the median values byNeighborhoodandMasVnrType.
# A tibble: 1 x 4
     Id Neighborhood MasVnrType MasVnrArea
  <dbl> <chr>        <chr>           <dbl>
1  2611 Mitchel      <NA>              198
# A tibble: 23 x 4
Id Neighborhood MasVnrType MasVnrArea
<dbl> <chr> <chr> <dbl>
1 235 Gilbert <NA> NA
2 530 Crawfor <NA> NA
3 651 Somerst <NA> NA
4 937 SawyerW <NA> NA
5 974 Somerst <NA> NA
6 978 Somerst <NA> NA
7 1244 NridgHt <NA> NA
8 1279 CollgCr <NA> NA
9 1692 Gilbert <NA> NA
10 1707 Somerst <NA> NA
# ... with 13 more rows# A tibble: 23 x 4
Id Neighborhood MasVnrType MasVnrArea
<dbl> <chr> <chr> <dbl>
1 235 Gilbert None NA
2 530 Crawfor None NA
3 651 Somerst None NA
4 937 SawyerW None NA
5 974 Somerst Stone NA
6 978 Somerst None NA
7 1244 NridgHt Stone NA
8 1279 CollgCr BrkFace NA
9 1692 Gilbert None NA
10 1707 Somerst Stone NA
# ... with 13 more rows- A new feature is generated where:
HasMasVnr=MasVnrArea> 0 - A significant number of properties have masonry.
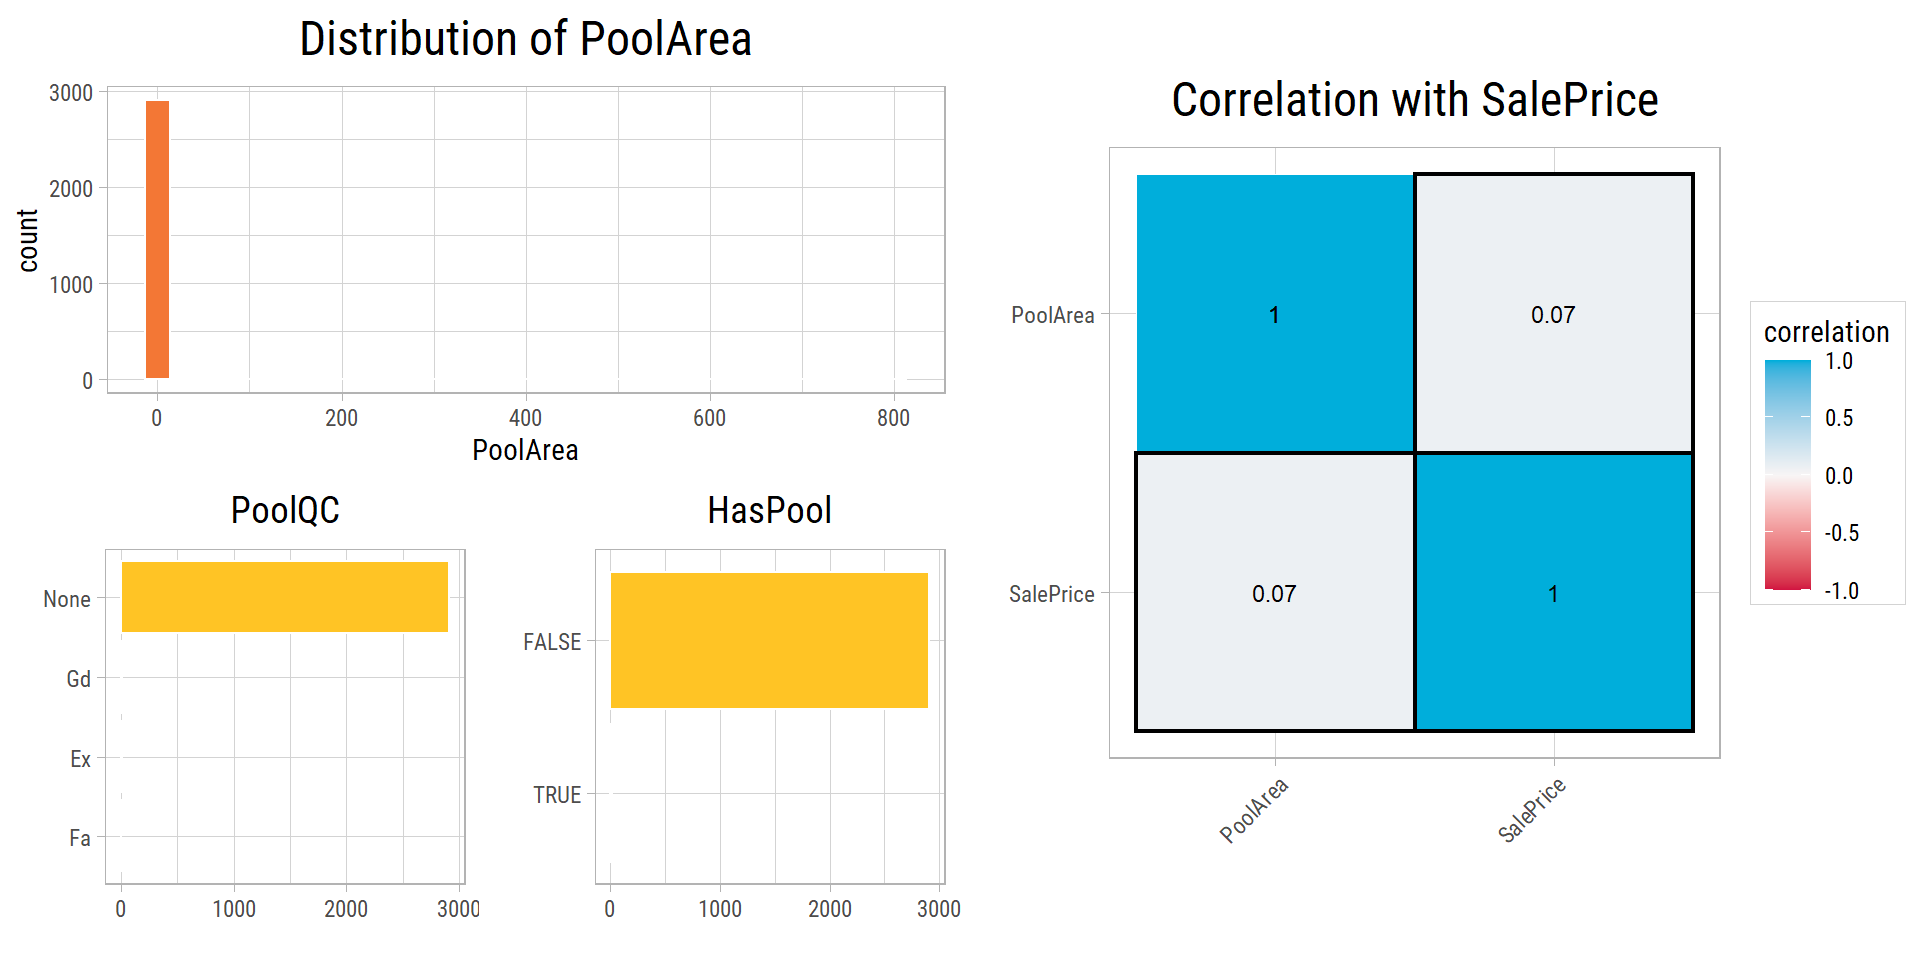
Pool Features
Change values in
PoolQCto None if the property has no poolImpute NA values in remaining
PoolQCto the most common value in the Neighborhood in the properties that have a pool.
# A tibble: 2,906 x 4
      Id Neighborhood PoolArea PoolQC
   <dbl> <chr>           <dbl> <chr>
 1     1 CollgCr             0 <NA>
 2     2 Veenker             0 <NA>
 3     3 CollgCr             0 <NA>
 4     4 Crawfor             0 <NA>
 5     5 NoRidge             0 <NA>
 6     6 Mitchel             0 <NA>
 7     7 Somerst             0 <NA>
 8     8 NWAmes              0 <NA>
 9     9 OldTown             0 <NA>
10    10 BrkSide             0 <NA>
# ... with 2,896 more rows
# A tibble: 3 x 4
Id Neighborhood PoolArea PoolQC
<dbl> <chr> <dbl> <chr>
1 2421 NAmes 368 <NA>
2 2504 SawyerW 444 <NA>
3 2600 Mitchel 561 <NA> - A new feature is generated where:
HasPool=PoolArea> 0 - Most properties do not have a pool.
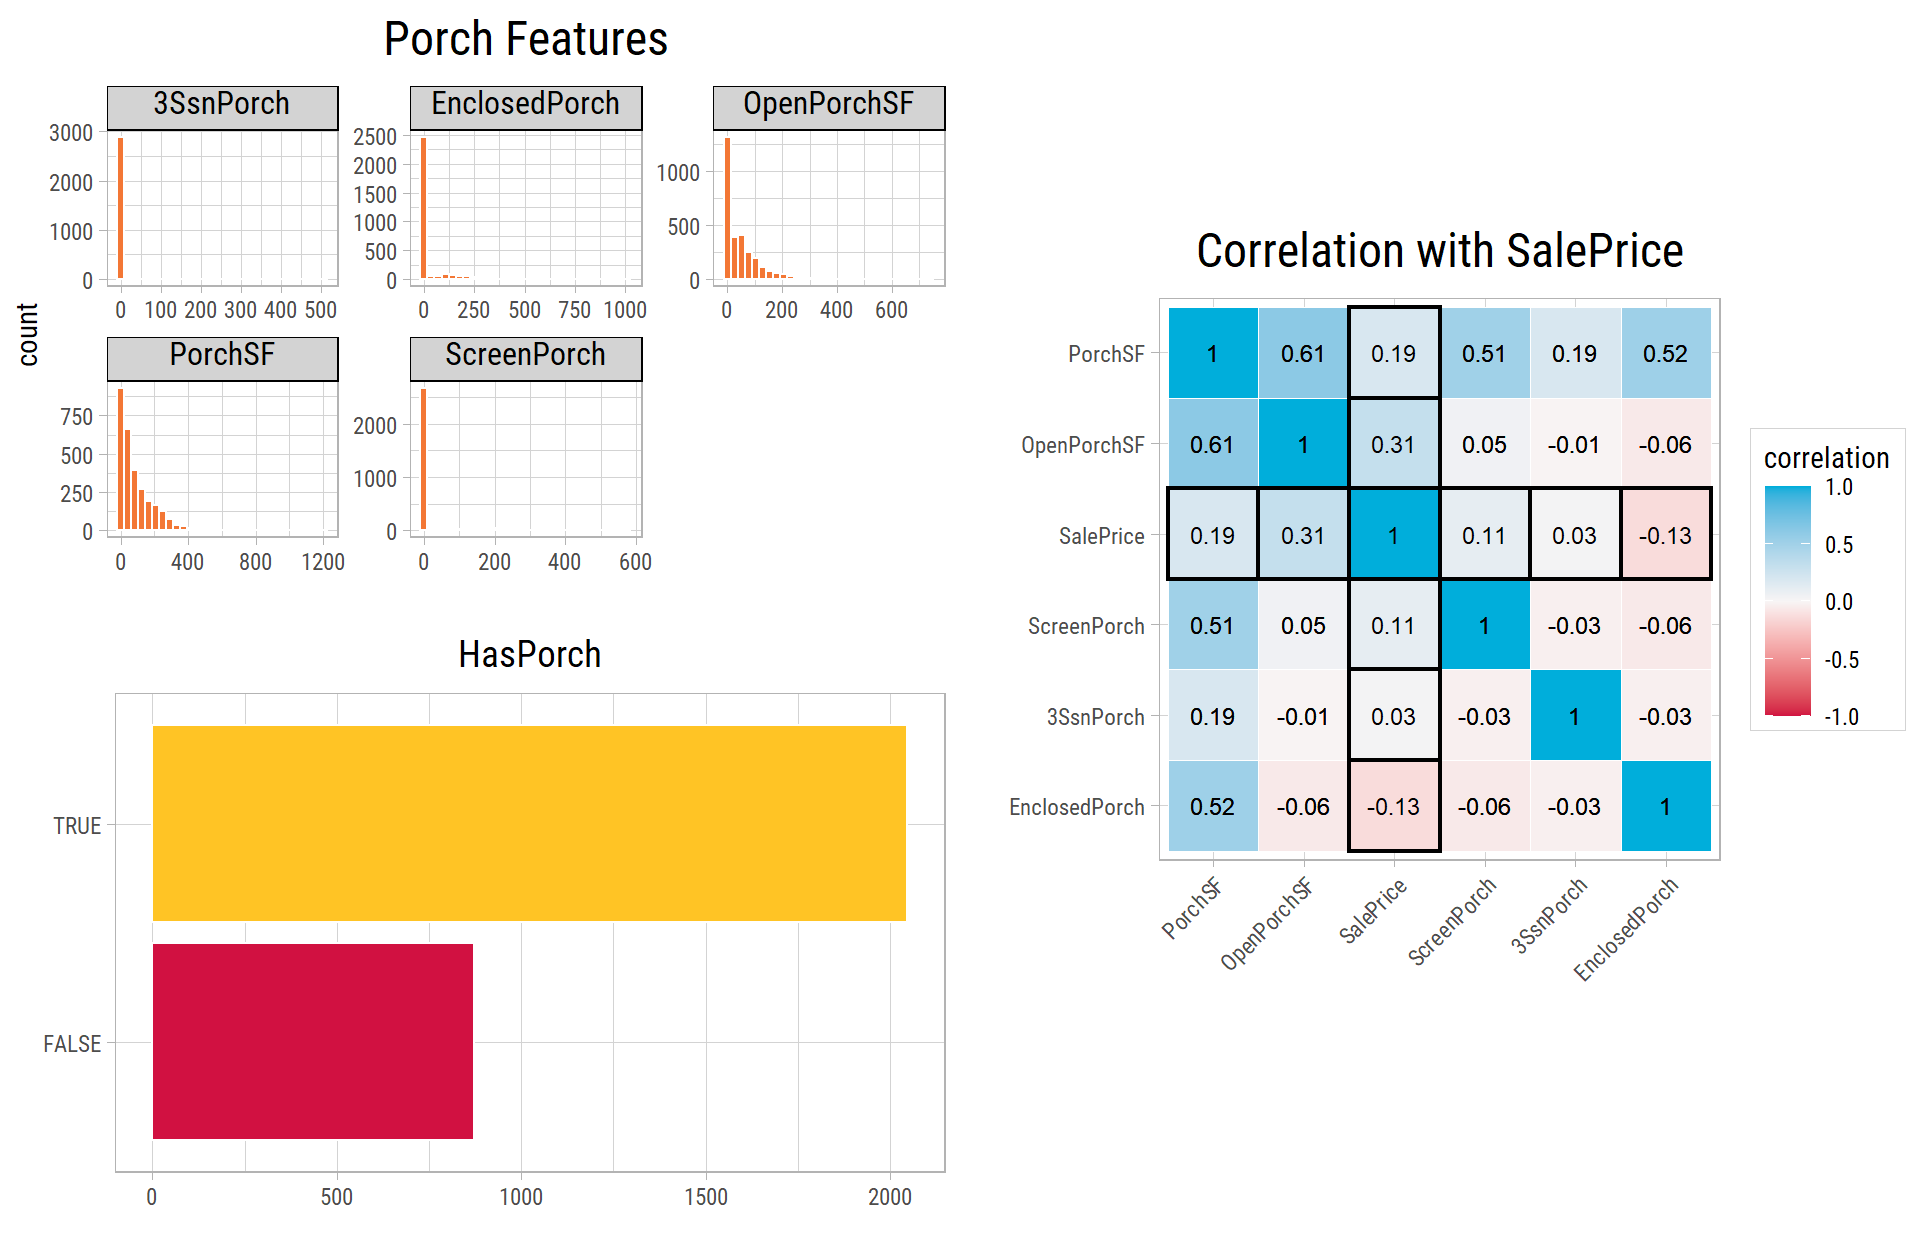
Porch Features
- New features are generated for:
- Total porch area:
PorchSF=OpenPorchSF+EnclosedPorch+3SsnPorch+ScreenPorch - Whether property has a porch:
HasPorch=PorchSF> 0
- Total porch area:
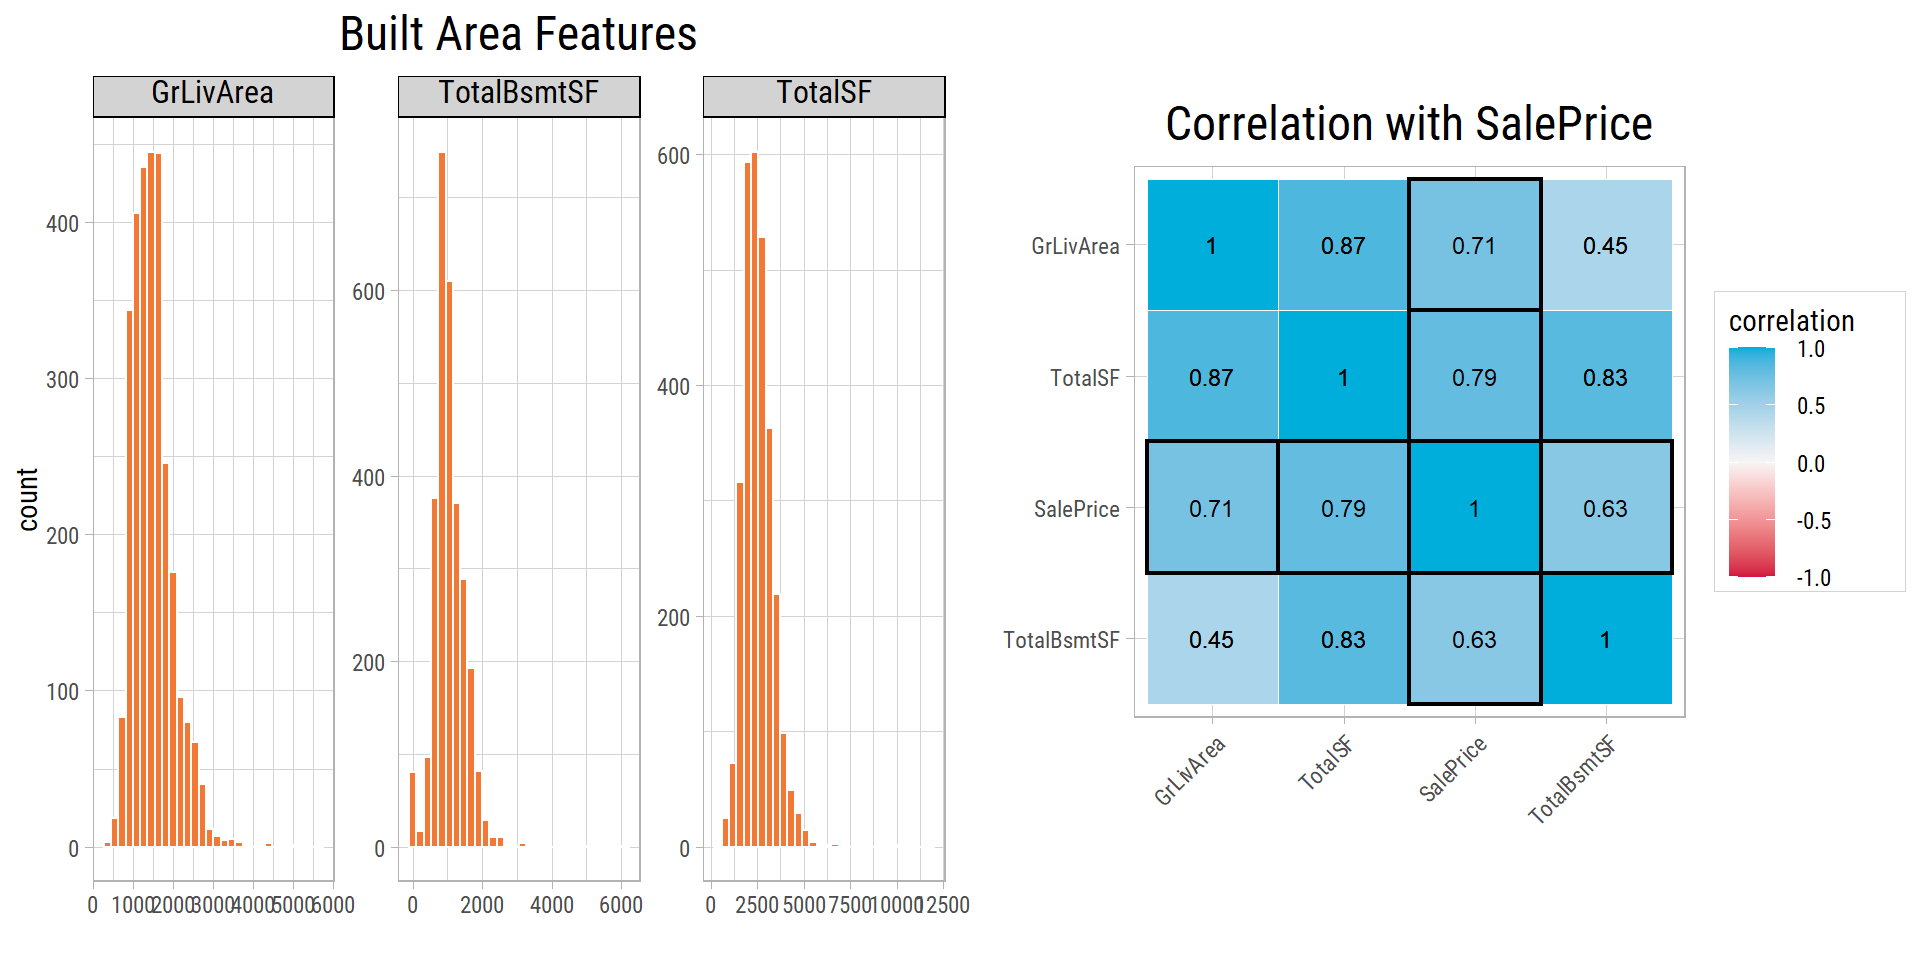
Built Area Features
- A new feature is added to determine the total square footage of built area:
TotalSF=GrLivArea+TotalBsmtSF
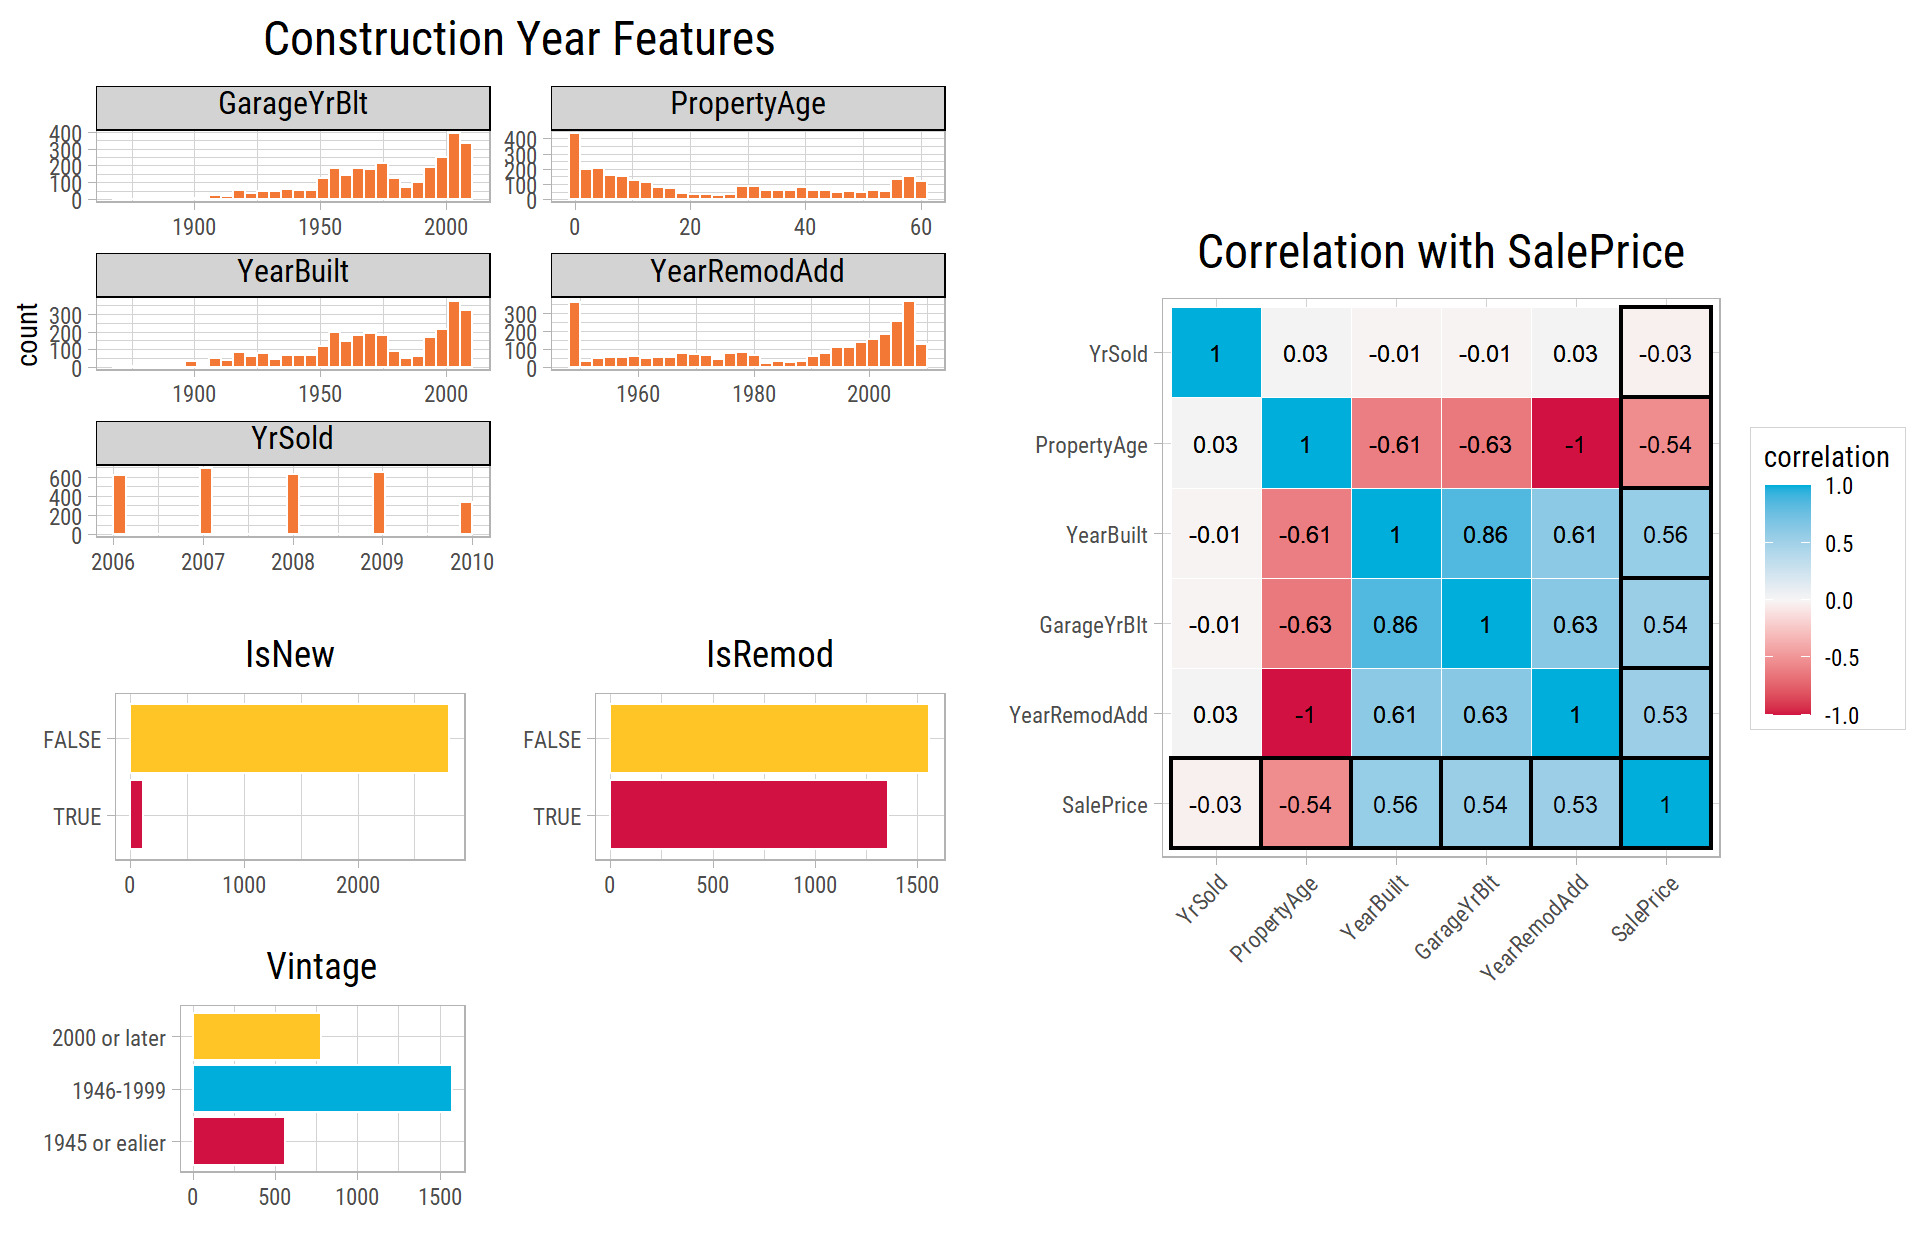
Construction Year Features
- New features are generated for:
- Vintage of year built: 1945 or earlier, 1946-1999, 2000 or later
- Age of property from when it was built to the time it was sold:
PropertyAge=YrSold-YearRemodAdd - Indicate if the property is new or newly renovated:
IsNew=YearRemodAdd==YrSold - Indicate if the property has been remodelled:
IsRemodAdd=YearRemodAdd>YearBuilt
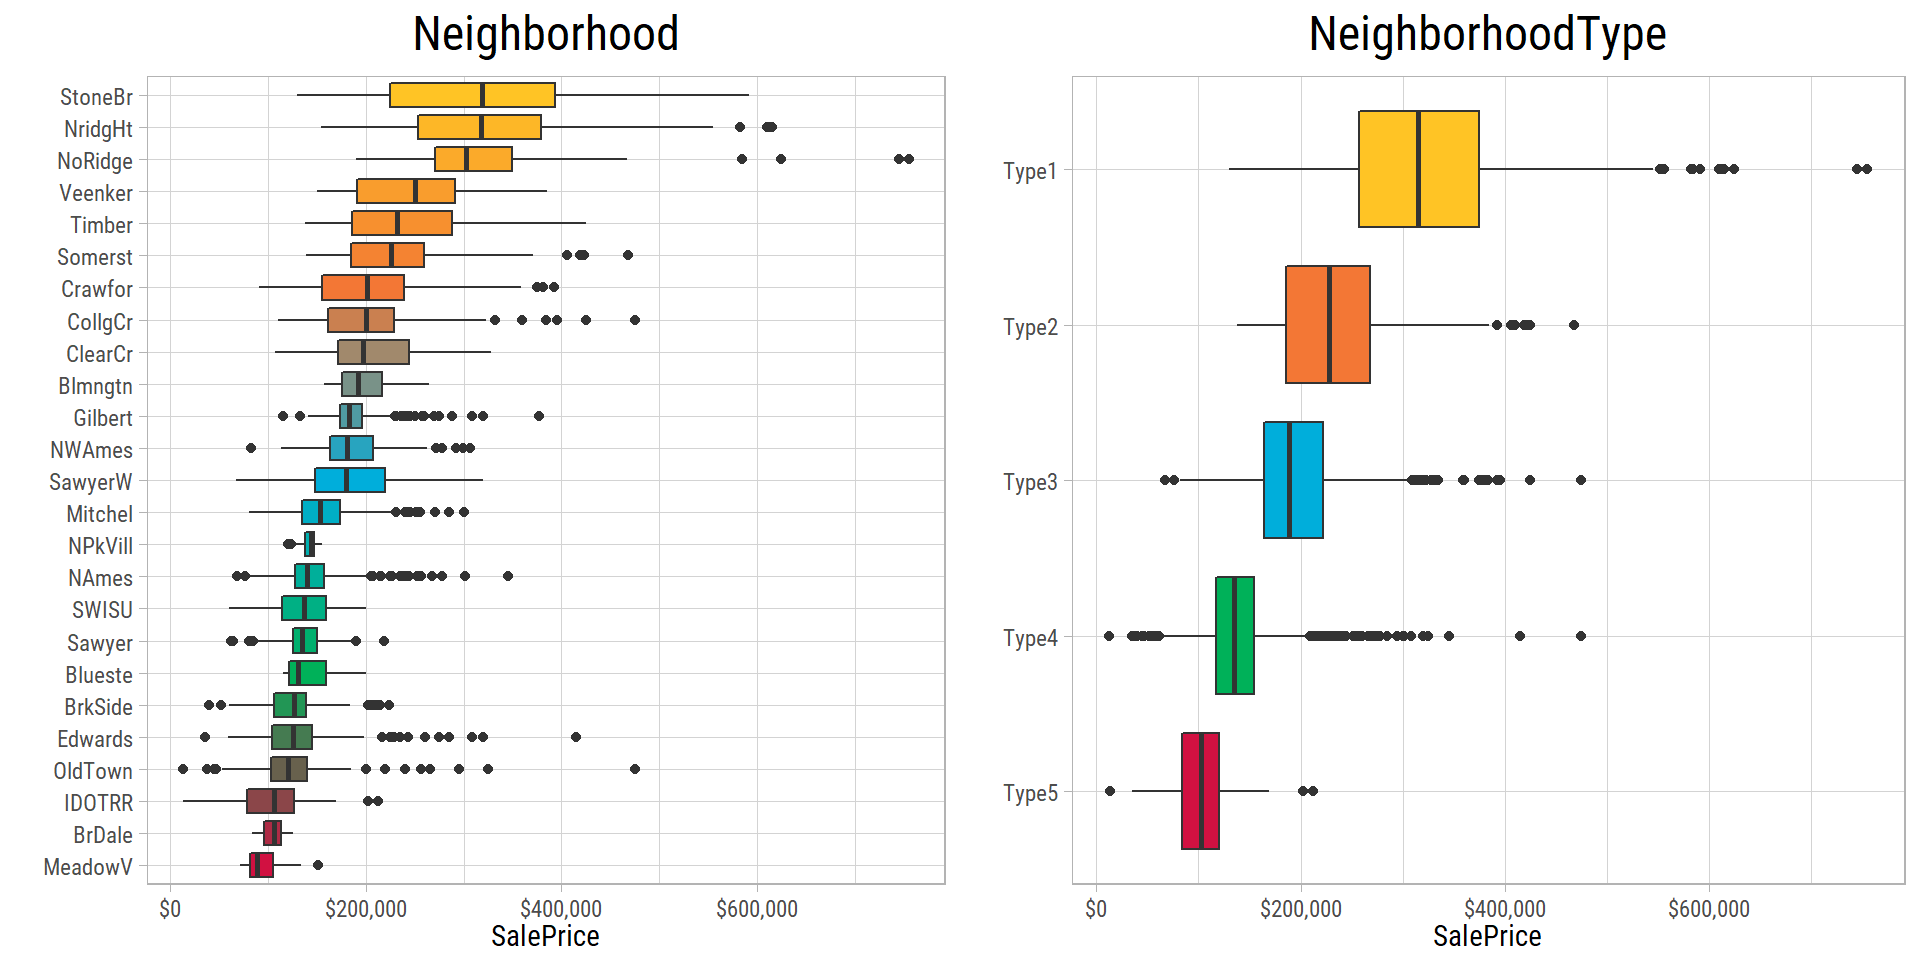
Neighborhood Features
Type of Neighborhood: There are 25 neighborhoods in the dataset. As it is said, real estate is all about location, location, location. Clearly some neighborhoods command higher prices than others.
Neighborhoods could be grouped together in fewer categories depending upon how they are ranked by their median SalePrice:
- Type1: StoneBr, NridgHt, NoRidge
- Type2: Veenker, Timber, Somerst
- Type3: Crawfor, CollgCr, ClearCr, Blmngtn, Gilbert, NWAmes, SawyerW
- Type4: Mitchel, NPkVill, NAmes, SWISU, Sawyer, Blueste, BrkSide, Edwards, OldTown
- Type5: IDOTRR, BrDale, MeadowV
Other Missing Features
In
MiscFeature,AlleyandFenceNA values are recoded as None.In
Utilities,Functional,SaleTypeNA values are imputed as the most common value of each feature.In
LotFrontageNA values are imputed as the median values in theNeighborhood.In
MSZoning,KitchenQual,Exterior1st,Exterior2nd,ElectricalNA values are imputed as the most common value in theNeighborhood.
Label Encoding
A quick look at the data description shows many features have categories that follow a specific order. These features are:
LotShape: Reg, IR1, IR2, IR3LandSlope: Gtl, Mod, SevExterQual: Ex, Gd, TA, Fa, PoExterCond: Ex, Gd, TA, Fa, PoBsmtQual: Ex, Gd, TA, Fa, Po, NoneBsmtCond: Ex, Gd, TA, Fa, Po, NoneBsmtExposure: Gd, Av, Mn, No, NoneBsmtFinType1: GLQ, ALQ, BLQ, Rec, LwQ, Unf, NoneBsmtFinType2: GLQ, ALQ, BLQ, Rec, LwQ, Unf, NoneHeatingQC: Ex, Gd, TA, Fa, PoCentralAir: Y, NKitchenQual: Ex, Gd, TA, Fa, PoFunctional: Typ, Min1, Min2, Mod, Maj1, Maj2, Sev, SalFireplaceQu: Ex, Gd, TA, Fa, Po, NoneGarageFinish: Fin, RFn, Unf, NoneGarageQual: Ex, Gd, TA, Fa, Po, NoneGarageCond: Ex, Gd, TA, Fa, Po, NoneStreet: Grvl, PavePavedDrive: Y, P, N
Most of these features have a common order Ex, Gd, TA, Fa, Po, except some are missing None as a category. These features could be ordered with a common set of categories from Ex, Gd, TA, Fa, Po, None.
Some categorical features are already ordered by an integer number. These features are:
OverallQual: 10 to 1OverallCond: 10 to 1
MoSold is cyclical and should be recoded as a factor.
YrSold has only 5 values from 2006-2010 and should also be recoded as a factor.
Categorical features where several categories have less than 10 observations are lumped into a single category named Other.
Features to Drop
Skewed Categorical Features
Any feature where more than 95% of the records have the same category probably doesn’t have any predictive value. An extreme case is Utilities which has only 2 categories - AllPub and NoSeWa in the dataset. Only 1 record has NoSeWa and the rest of the records have AllPub. Therefore, features like these do not have any predictive value.
Finalized Data
[1] "Dimensions of the finalized dataset"[1] 2919 73Excluding Id, there are 72 features in the finalized dataset.There are 26 numerical, 26 ordinal and 20 nominal features.Univariate Analysis
Let us look at each feature in the dataset in detail.
Numerical Features
First let’s plot all the features that are measured as area in square feet:
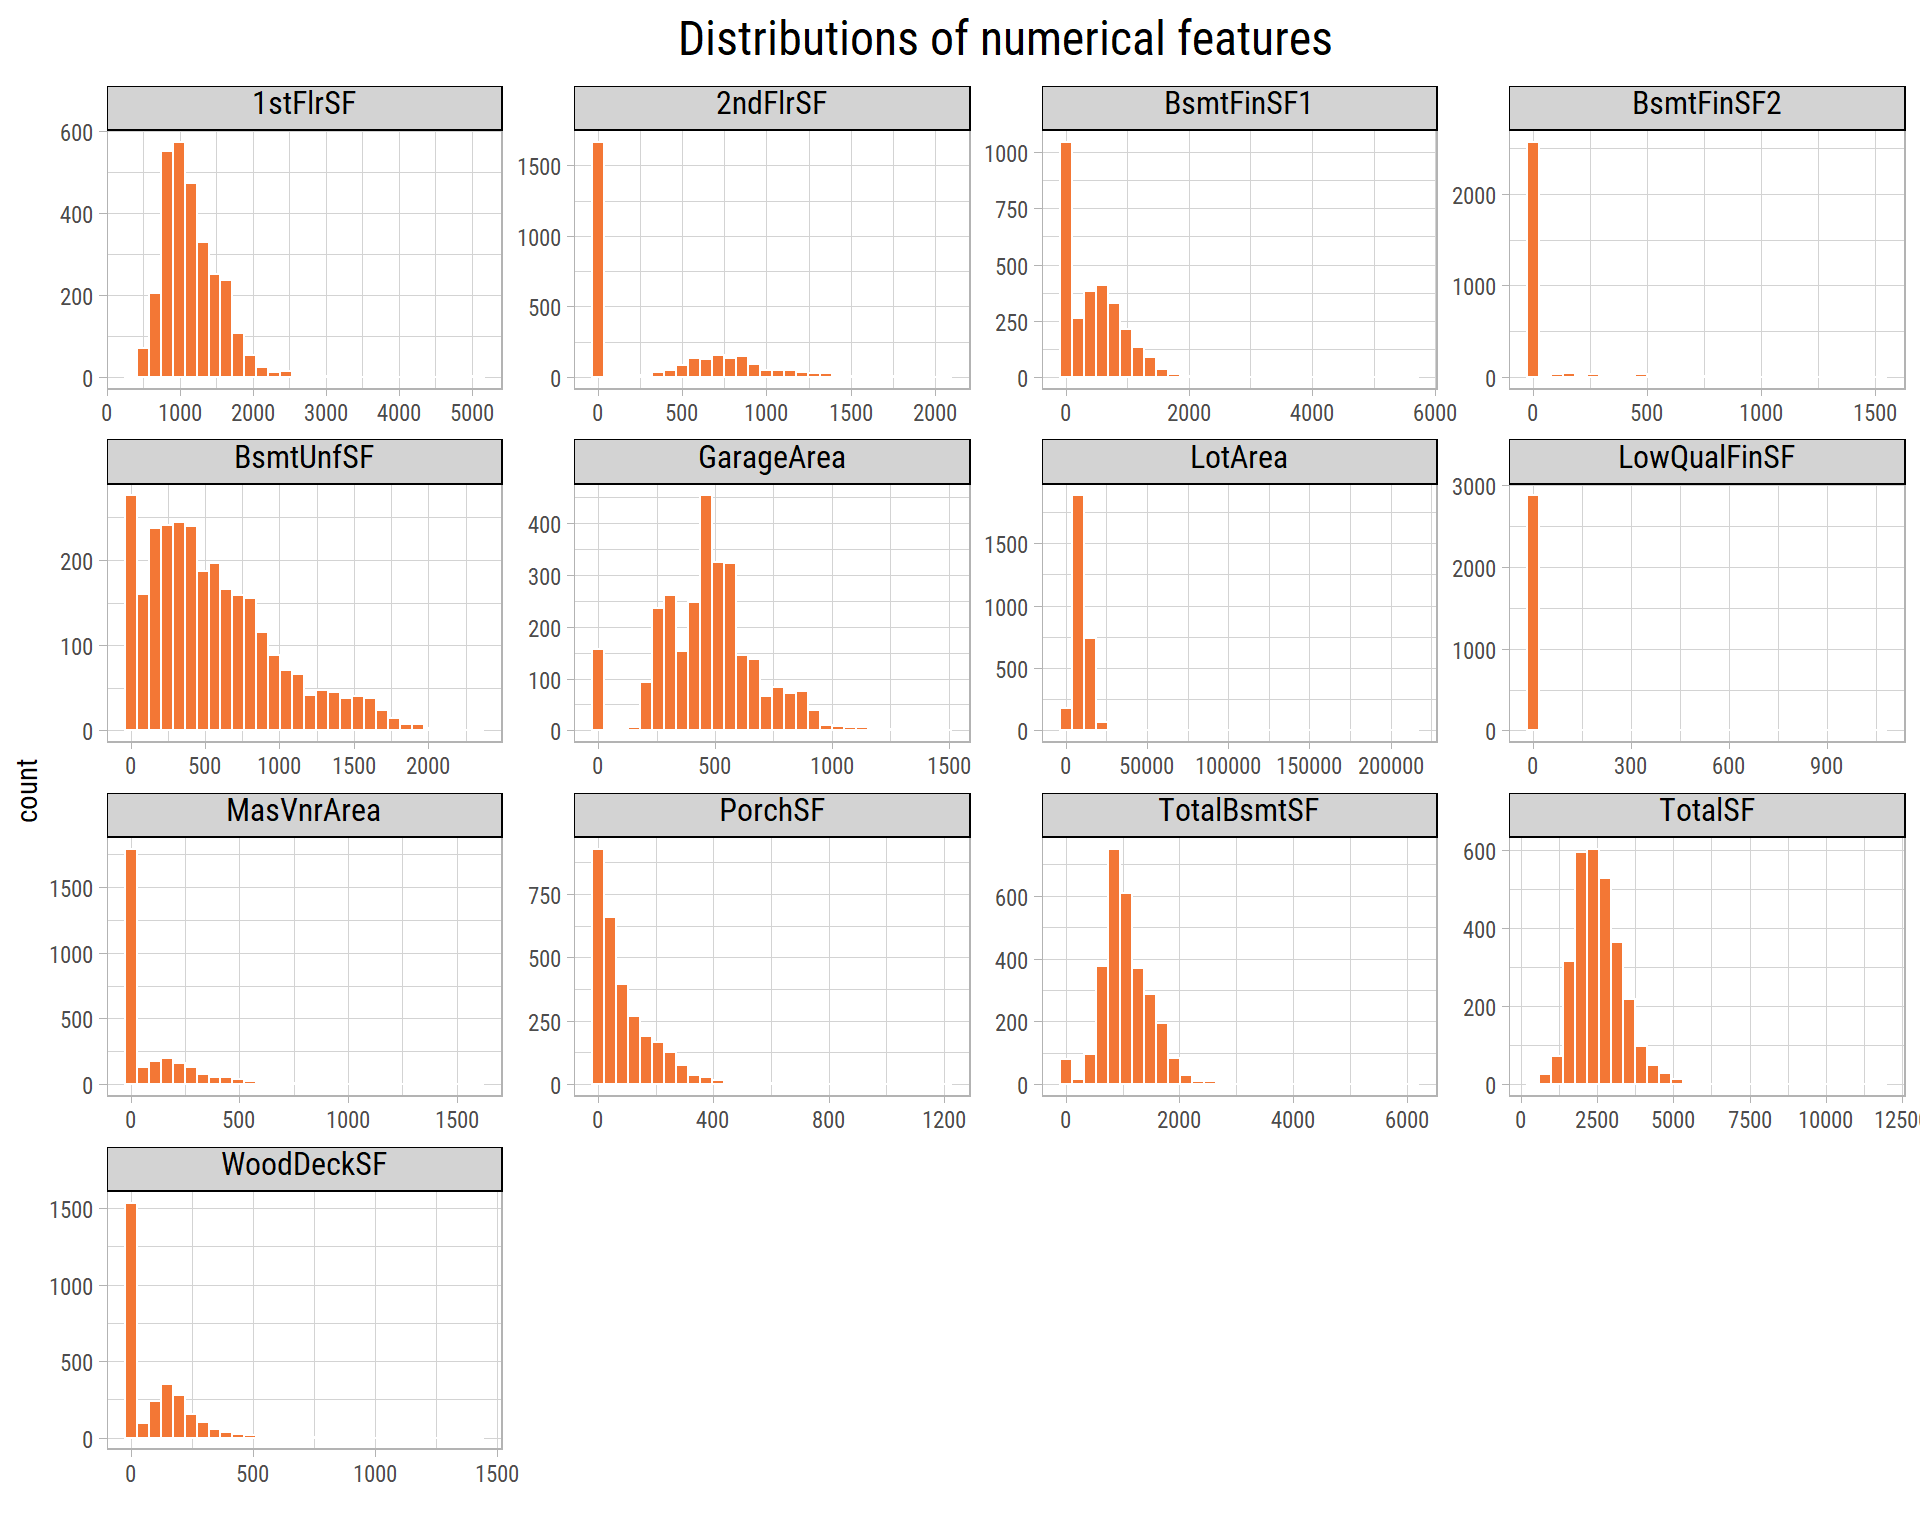
What’s notable?
- All area features have outliers.
- Many features are heavily skewed so they need to be normalized before fitting models.
Now let’s see other numerical features:
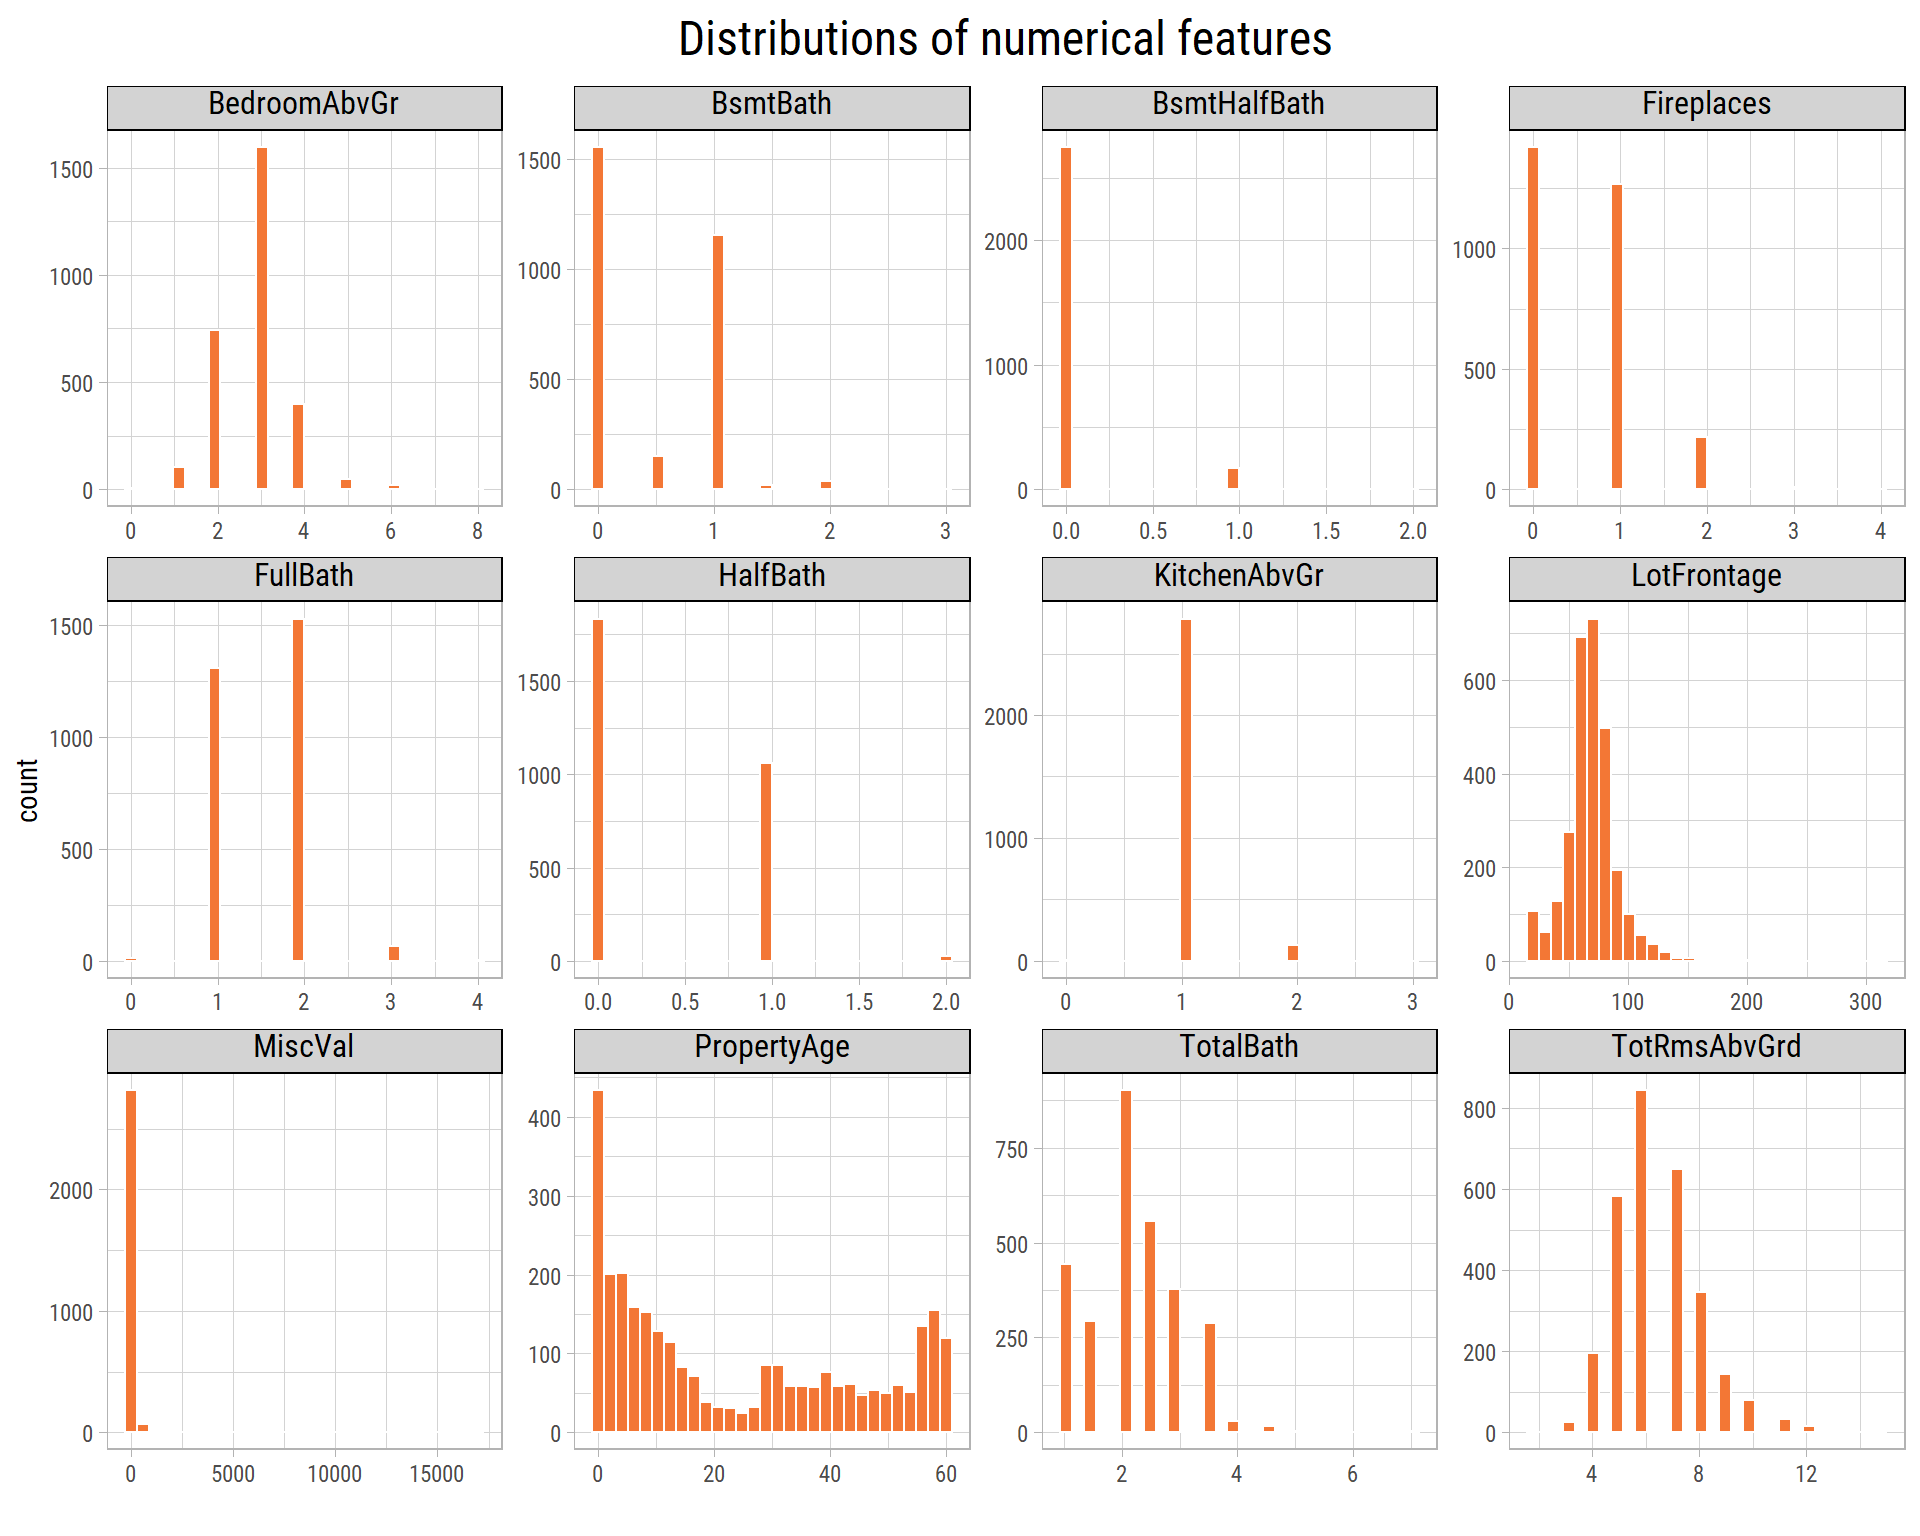
What’s notable?
- Most of the properties have been built less than 20 years prior to their sale.
Let’s plot the distribution of SalePrice in log scale:
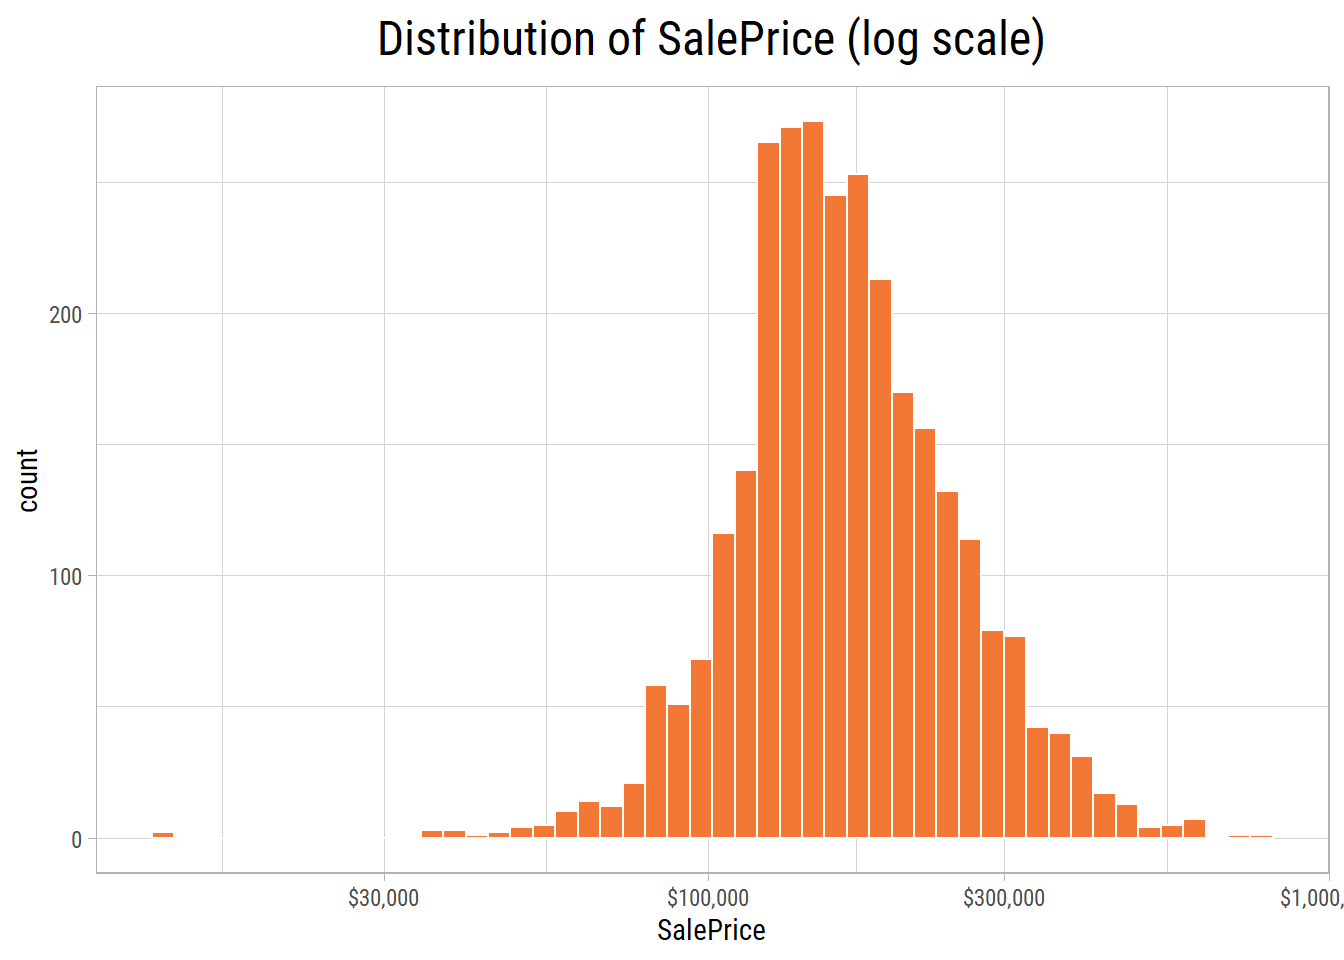
What’s notable?
- We see long tailed distribution on both sides.
- There are 11 properties below USD 50,000 and 17 above USD 500,000.
- Linear models are very sensitive to the presence of outliers.
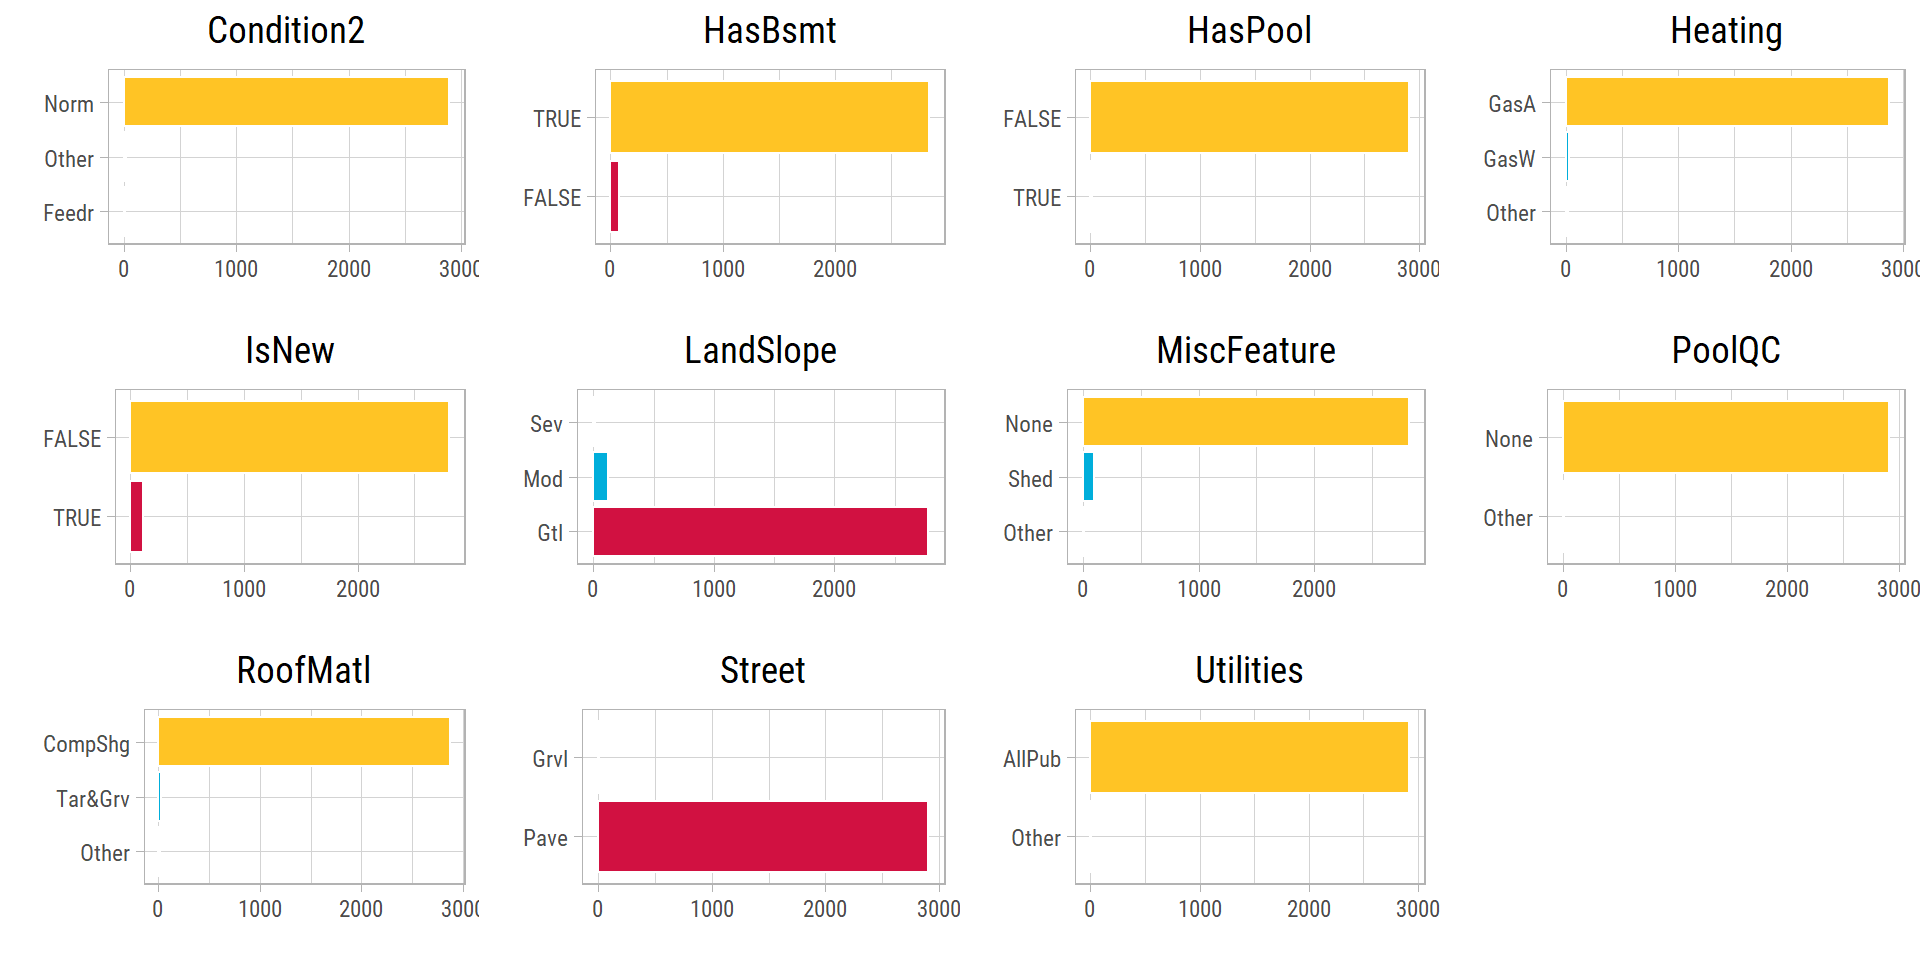
Categorical Features
Ordinal Features
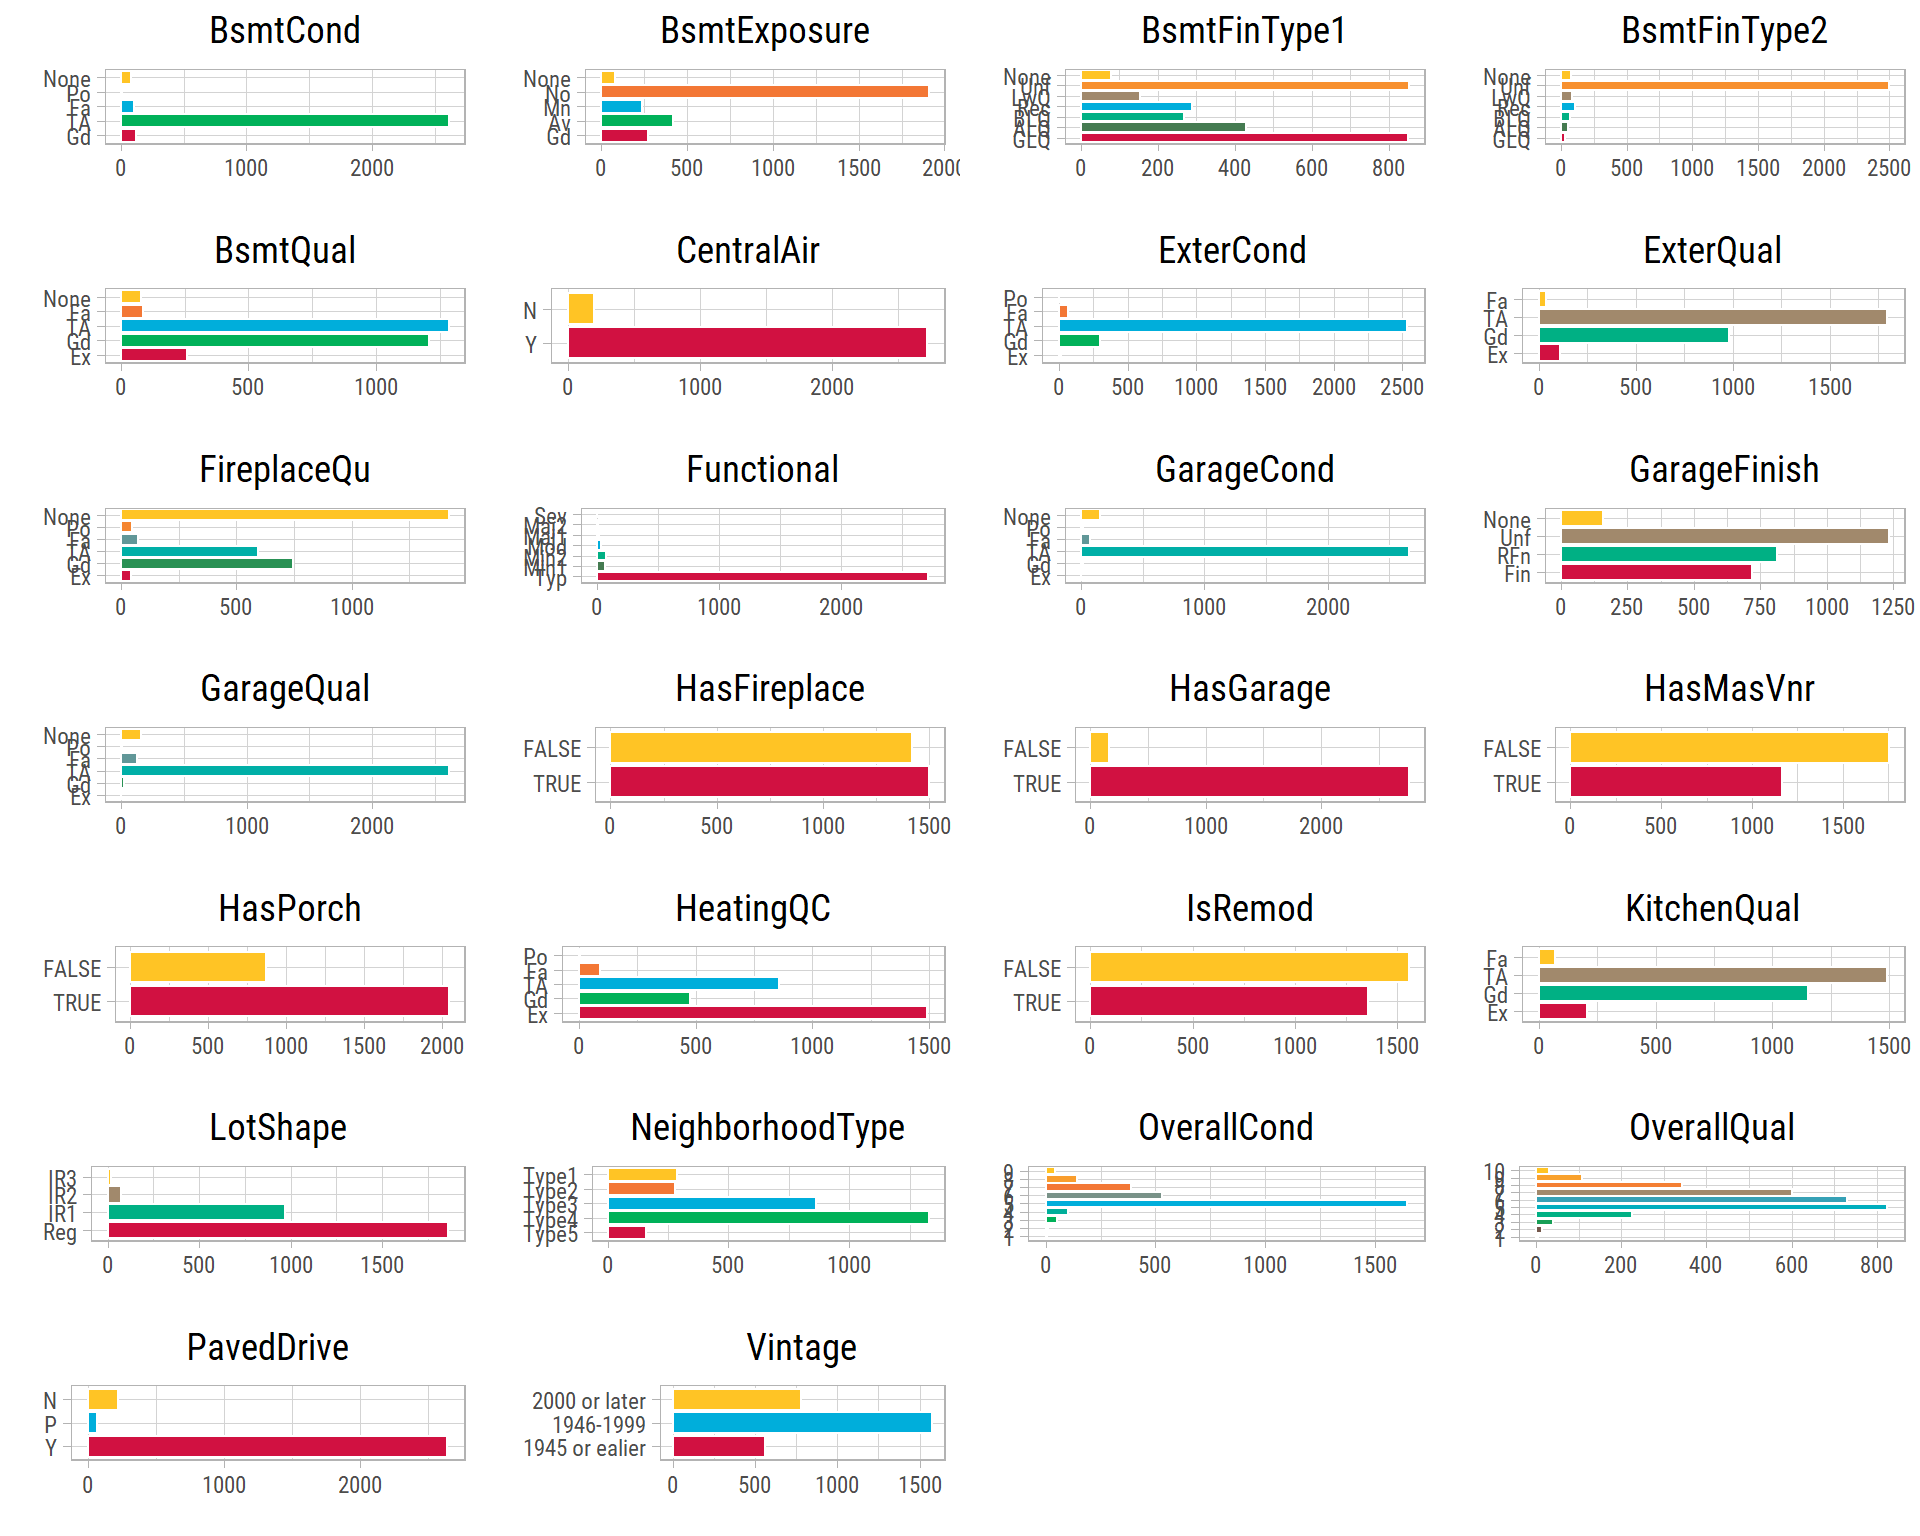
What’s notable?
- Categorical imbalances exist in many features where 1 or 2 categories are dominant. This poses a big challenge for using these features as predictors, as categories with fewer counts tend to be underrepresented in the data.
Nominal Features.
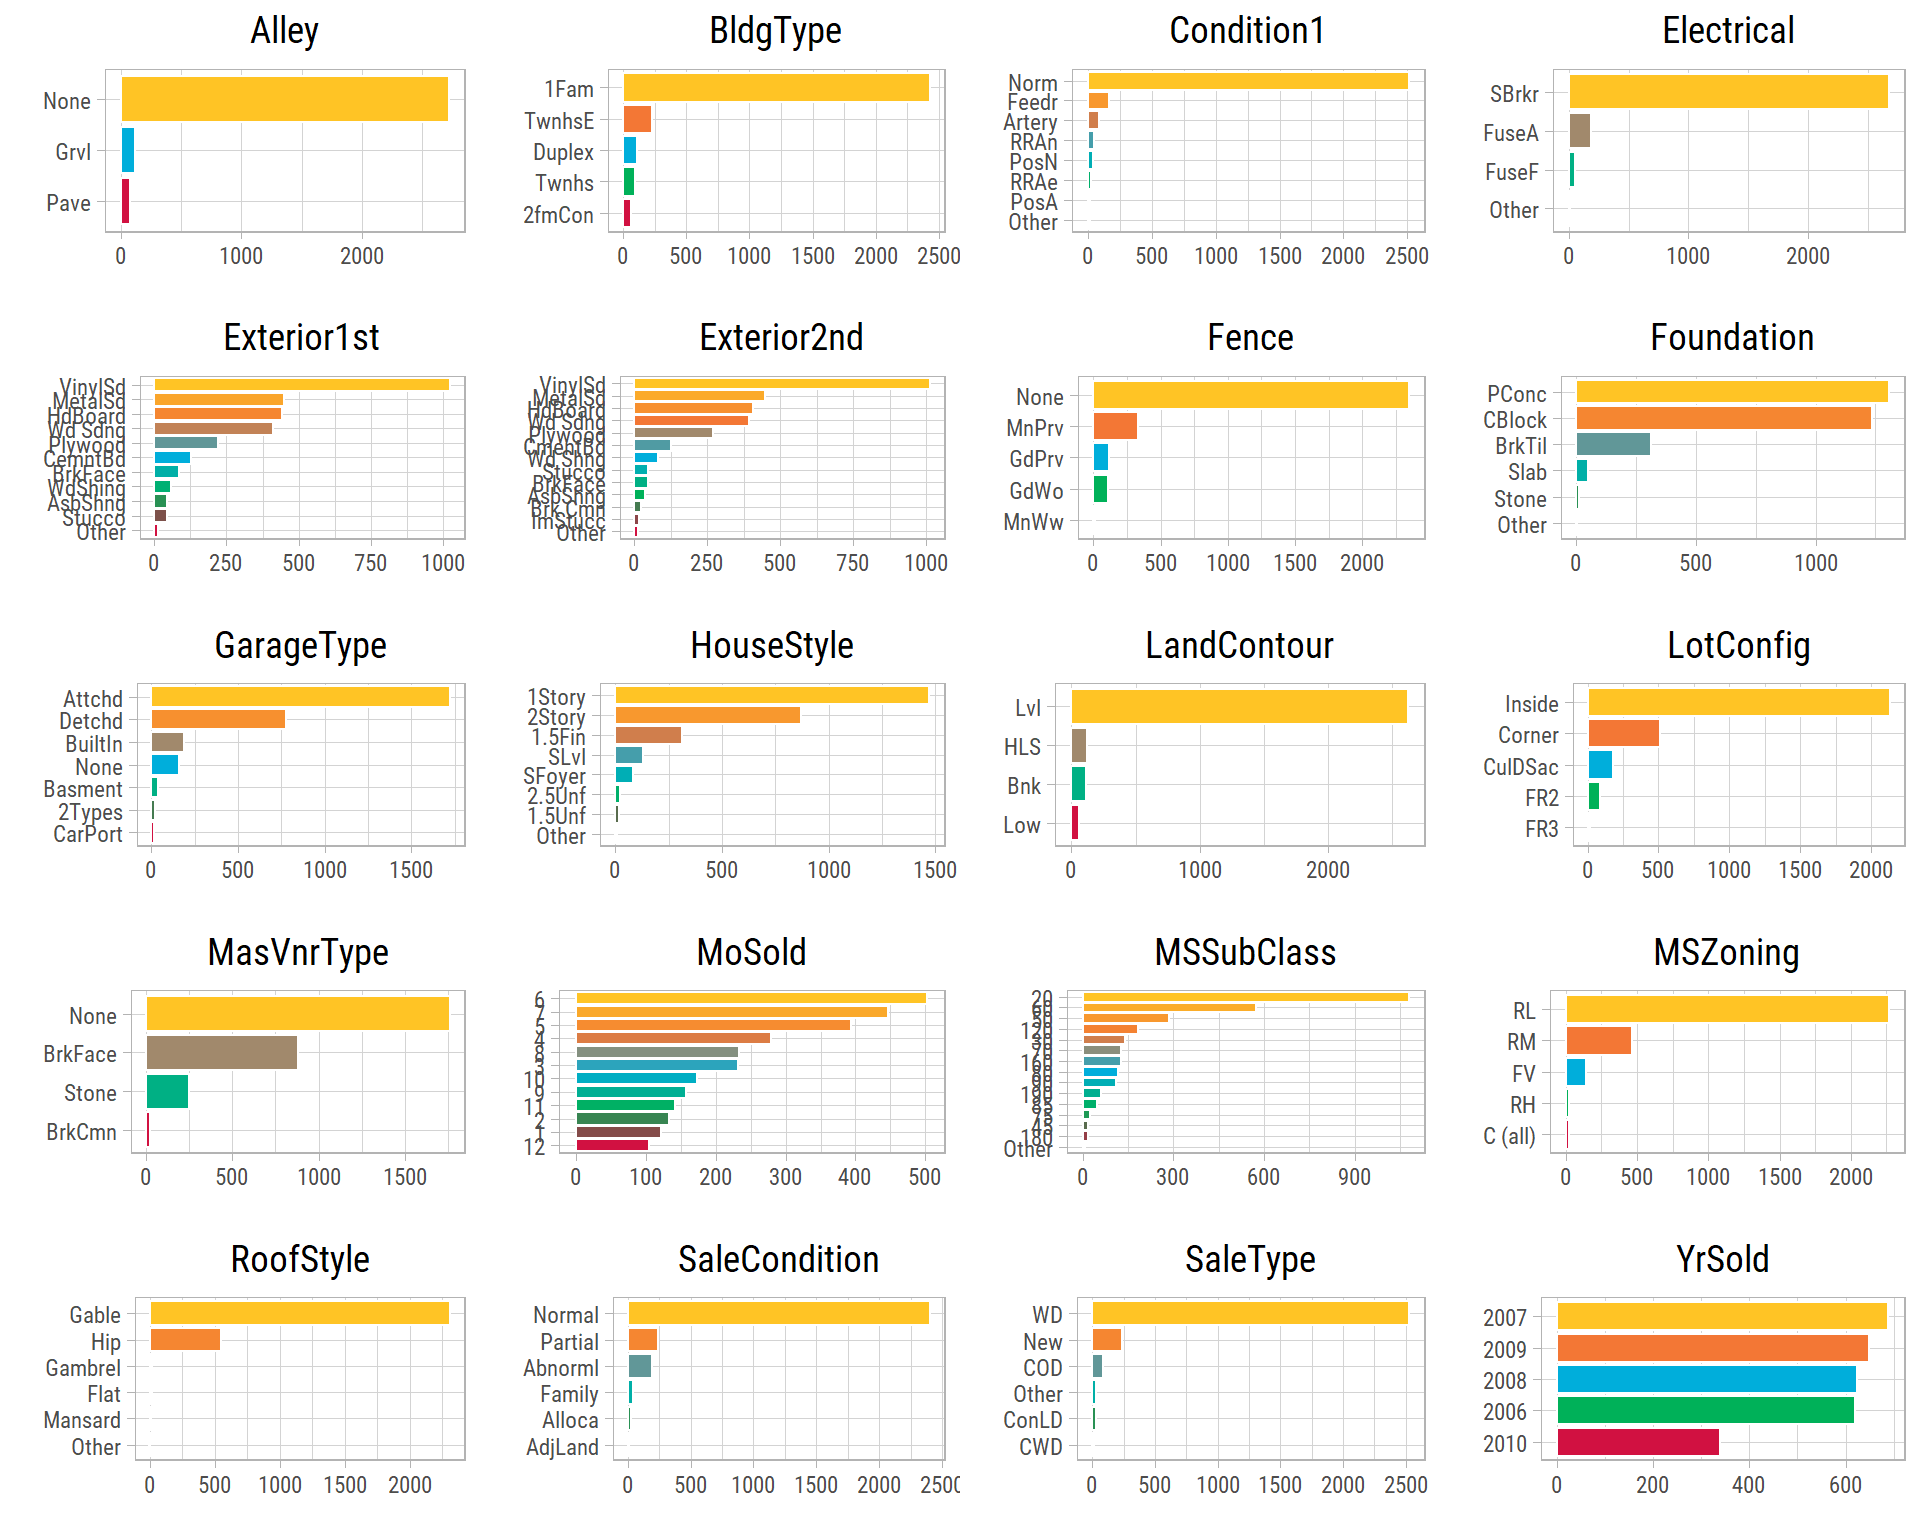
What’s notable?
- Categorical imbalances exist in many features where 1 or 2 categories are dominant.
- Most of the properties are sold during the summer months, and the least during the winter months.
- The effect of housing market crisis are visible in the data, as the fewest properties were sold in 2010.
Bivariate Analysis
Numerical-Numerical
Let’s examine the relationship of SalePrice with other numerical features:
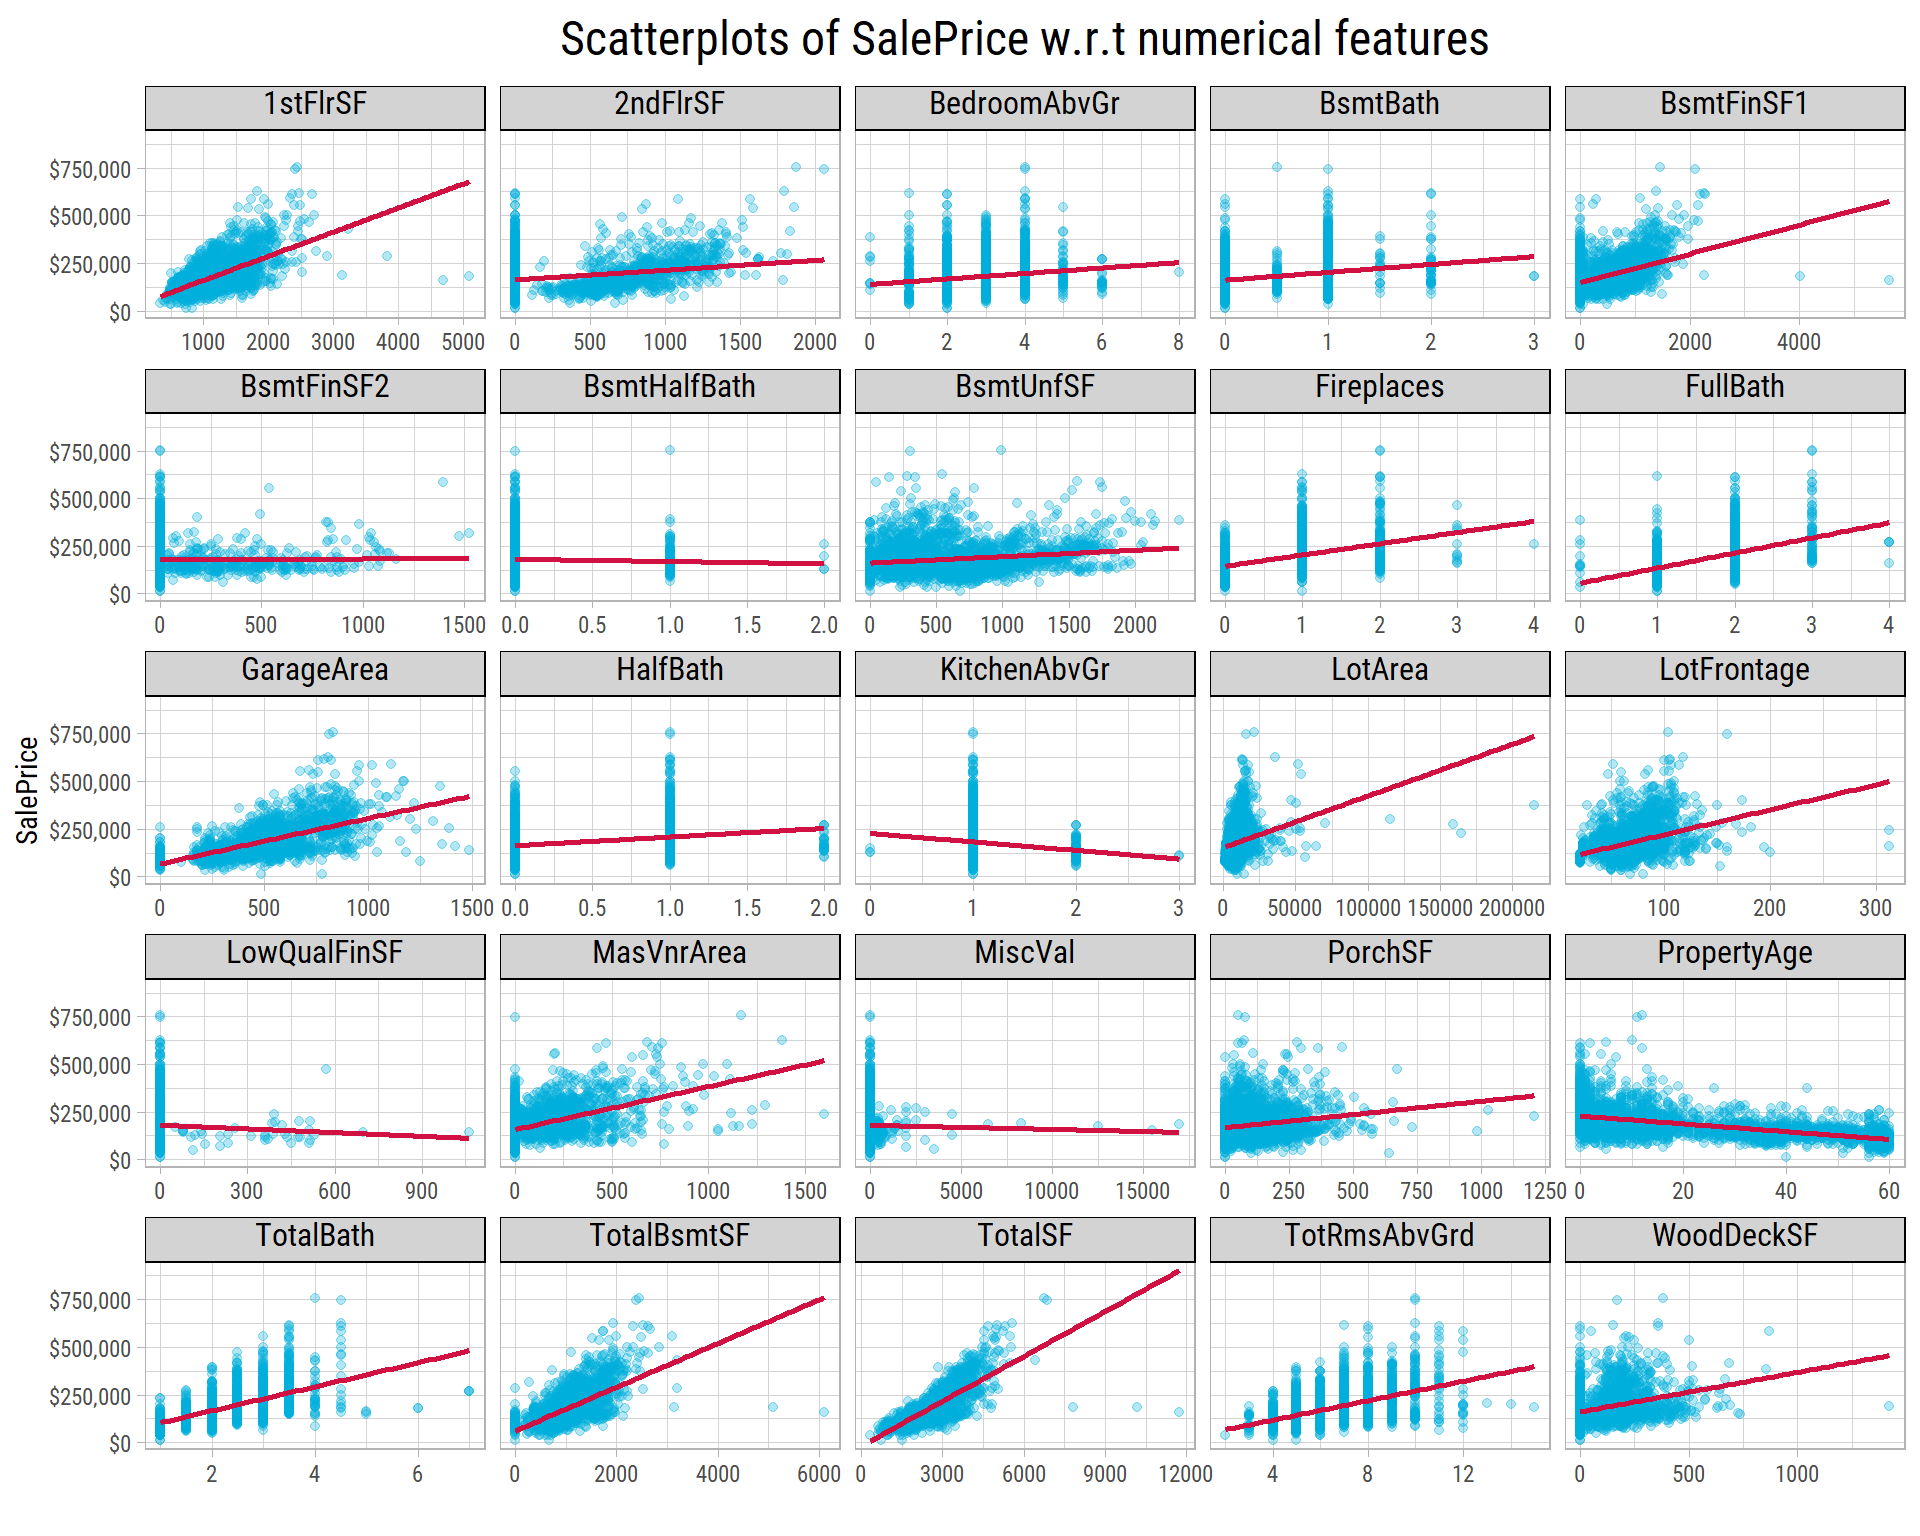
What’s notable?
- From the scatterplot of
TotalSFv/sSalePrice, it is very clear there are high leverage points where the targetSalePriceis unusually low relative to the area in sq. ft. These points have an outsized impact on the slope of the regression line, which otherwise would be higher. - The same set of points impact
TotalBsmtSF. - The Ids of these records are 524,1299,2550. Out of these 524 and 1299 are in the training set.
Correlations with SalePrice
We isolate the features that have an absolute correlation of 0.1 or more with SalePrice.
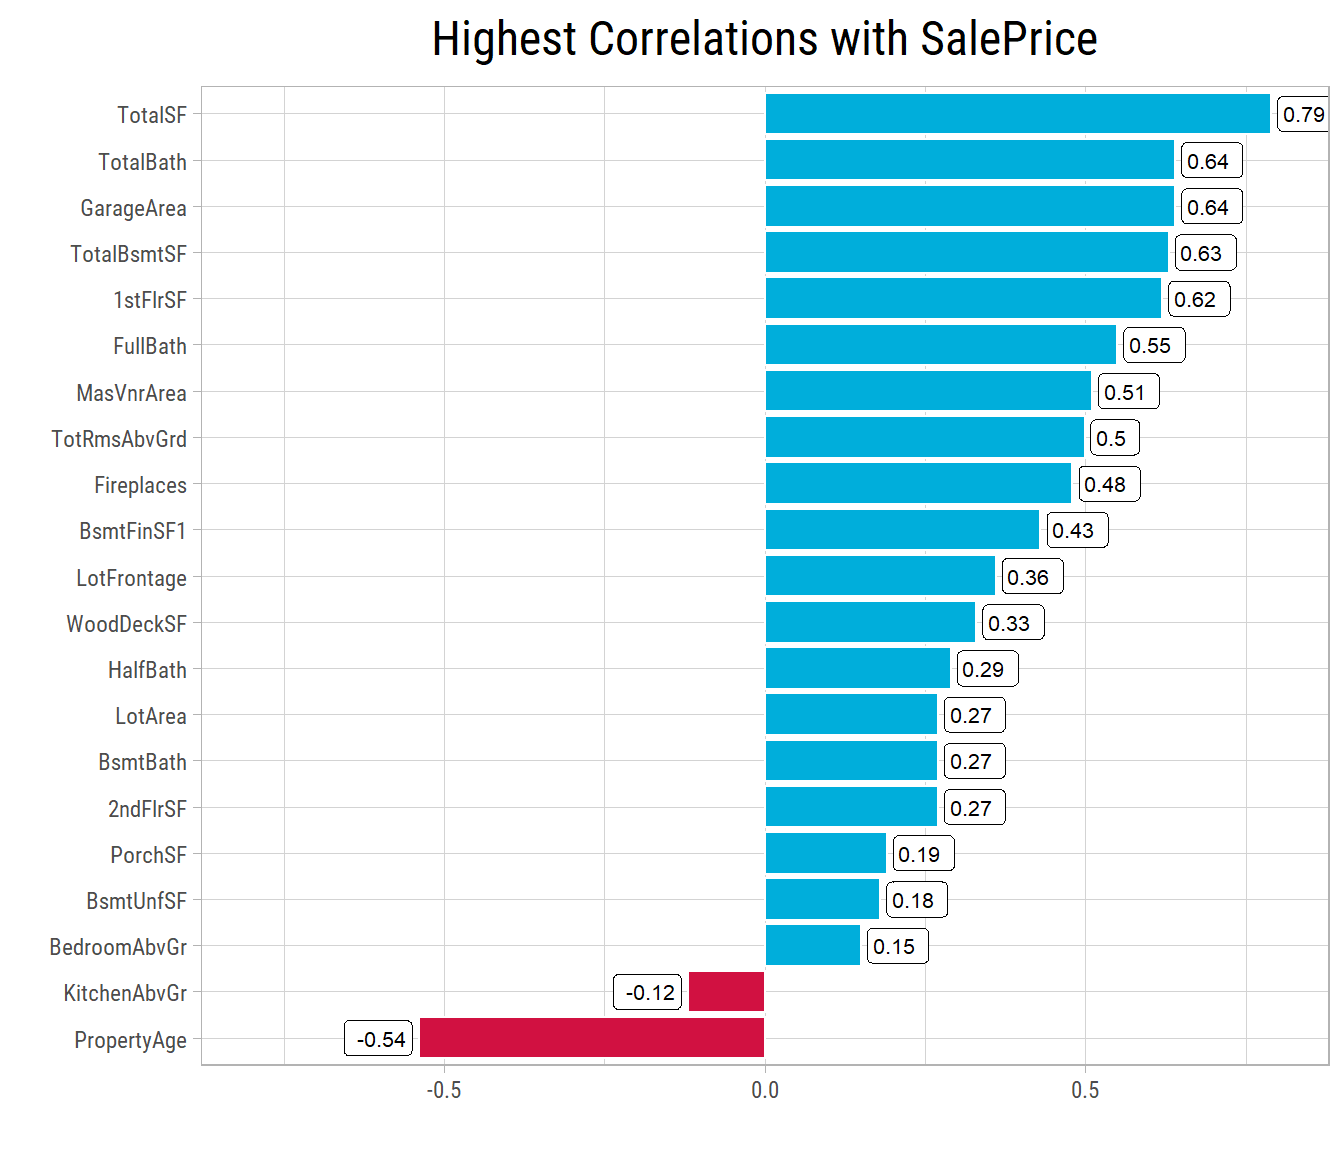
What’s notable?
- The top 5 features are TotalSF, GarageArea, TotalBath, TotalBsmtSF, 1stFlrSF. Quite reasonably, a buyer would look at these features to evaluate a property and its
SalePrice. - It is somewhat counterintuitive that
PropertyAgeshows a strong negative correlation withSalePrice. It means properties that were more recently built, sell for higher prices than older properties.
Numerical-Categorical (Ordinal)
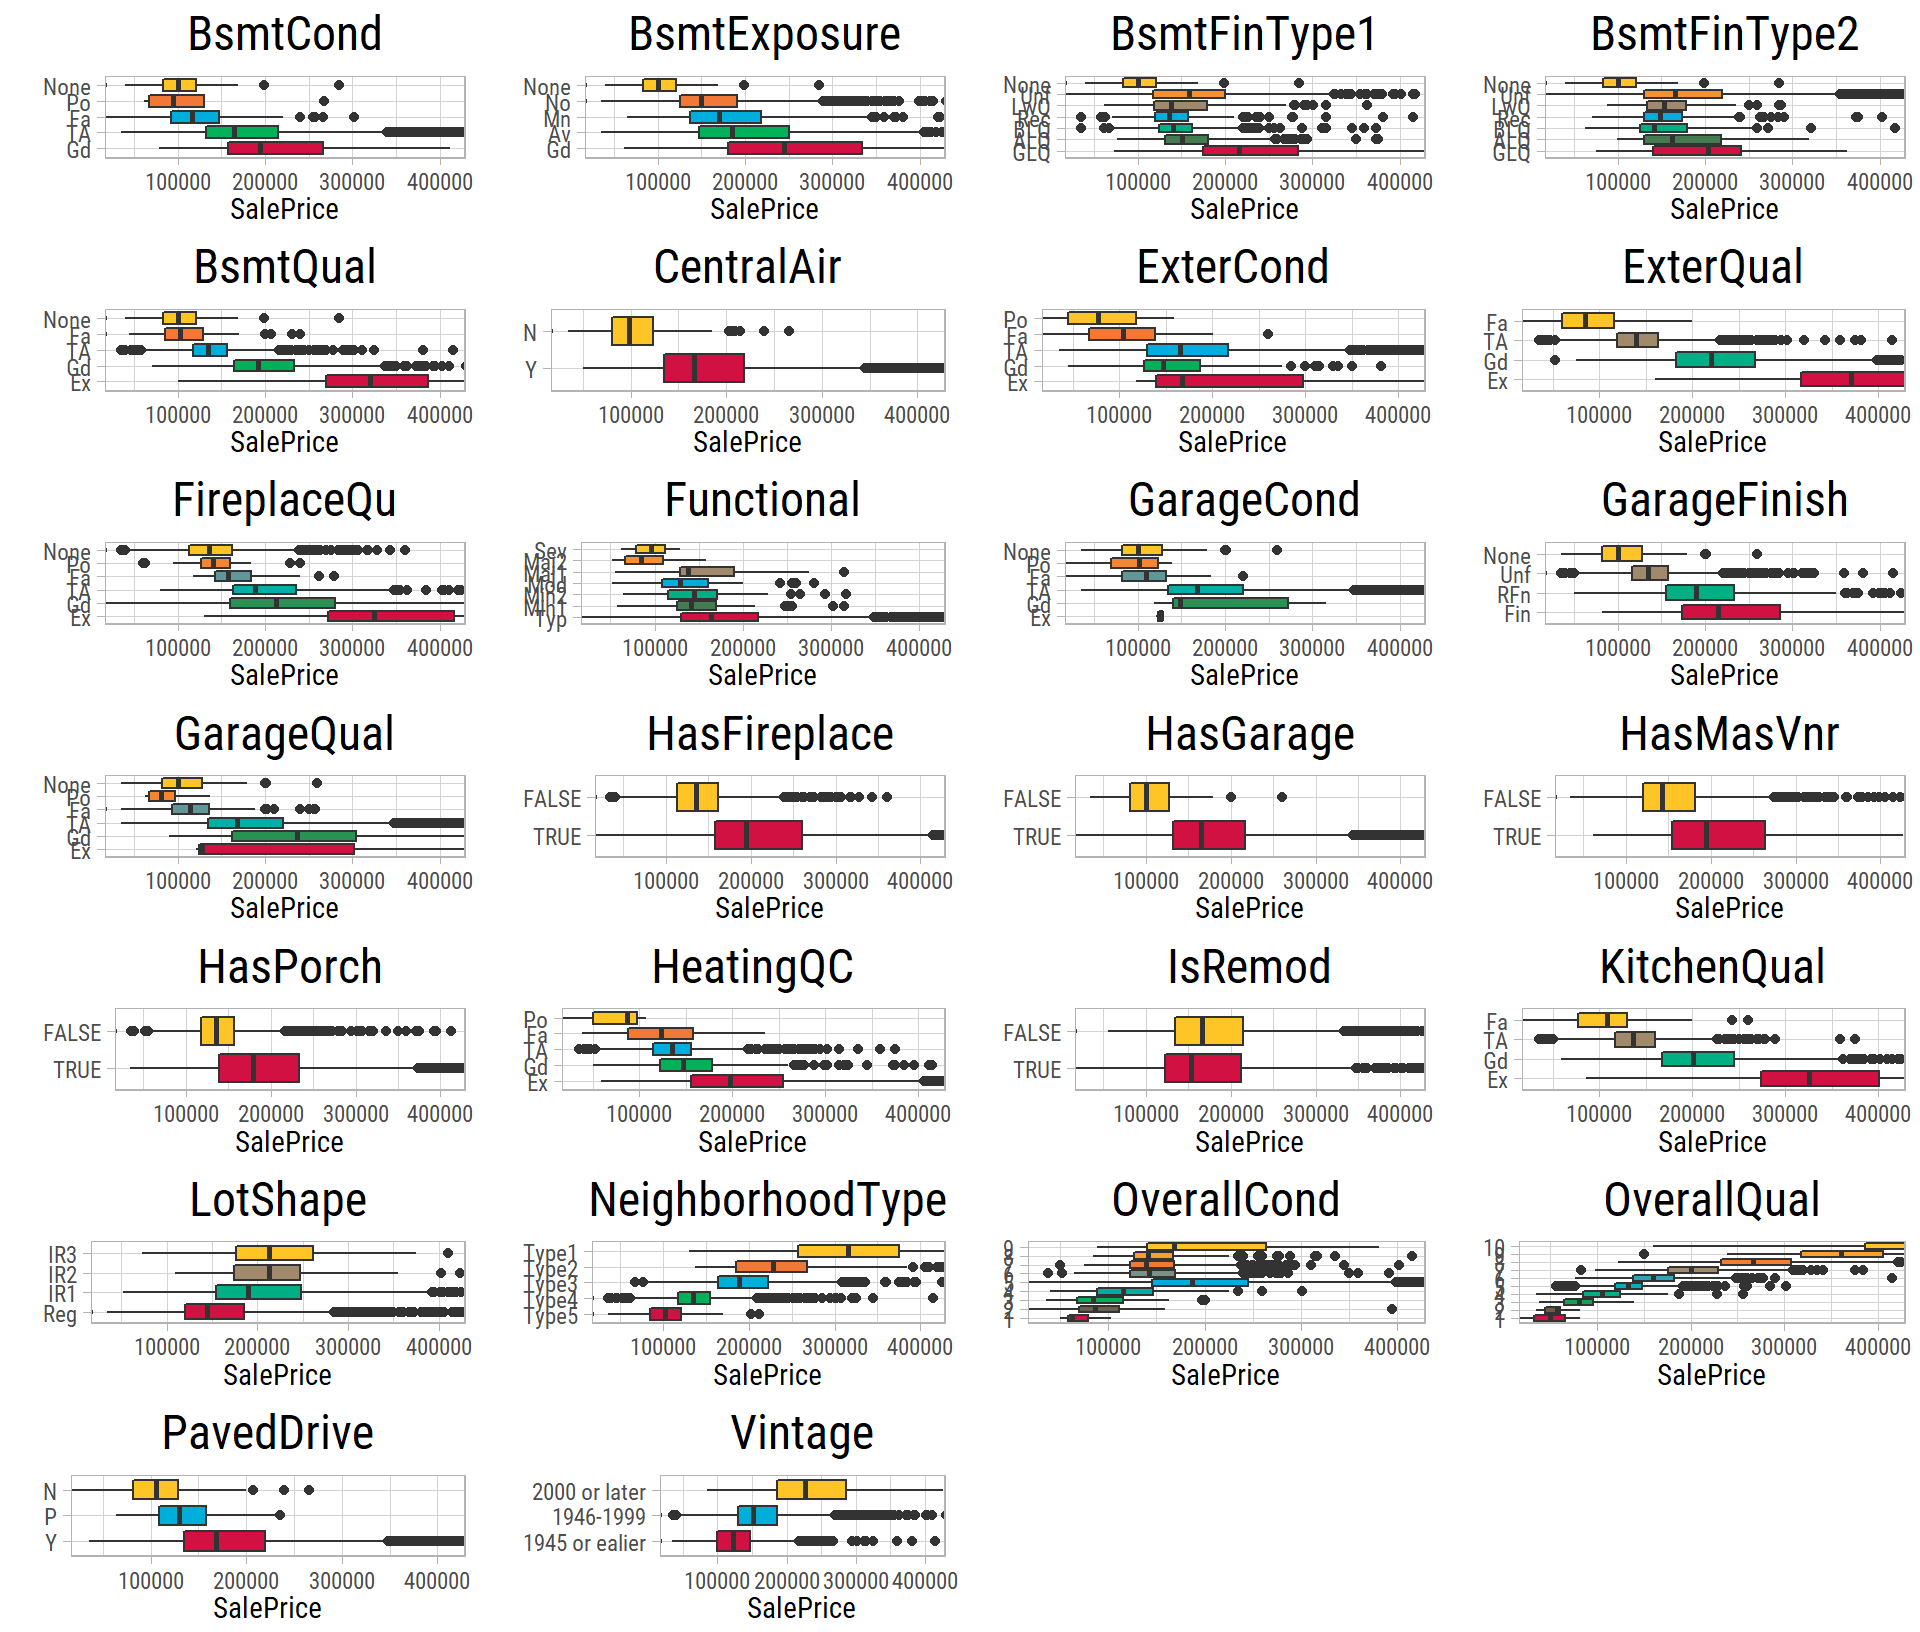
What’s notable?
- We can spot clear trends in
SalePricev/s the order of the categories in almost all of these features. - Overall quality and external quality show some of the strongest trends.
Numerical-Categorical (Nominal)
Let’s examine SalePrice with respect to the nominal features in the dataset. None of these features have a natural order, but we can identify trends within categories by sorting with the median SalePrice. The SalePrice axis is truncated to exclude outliers.
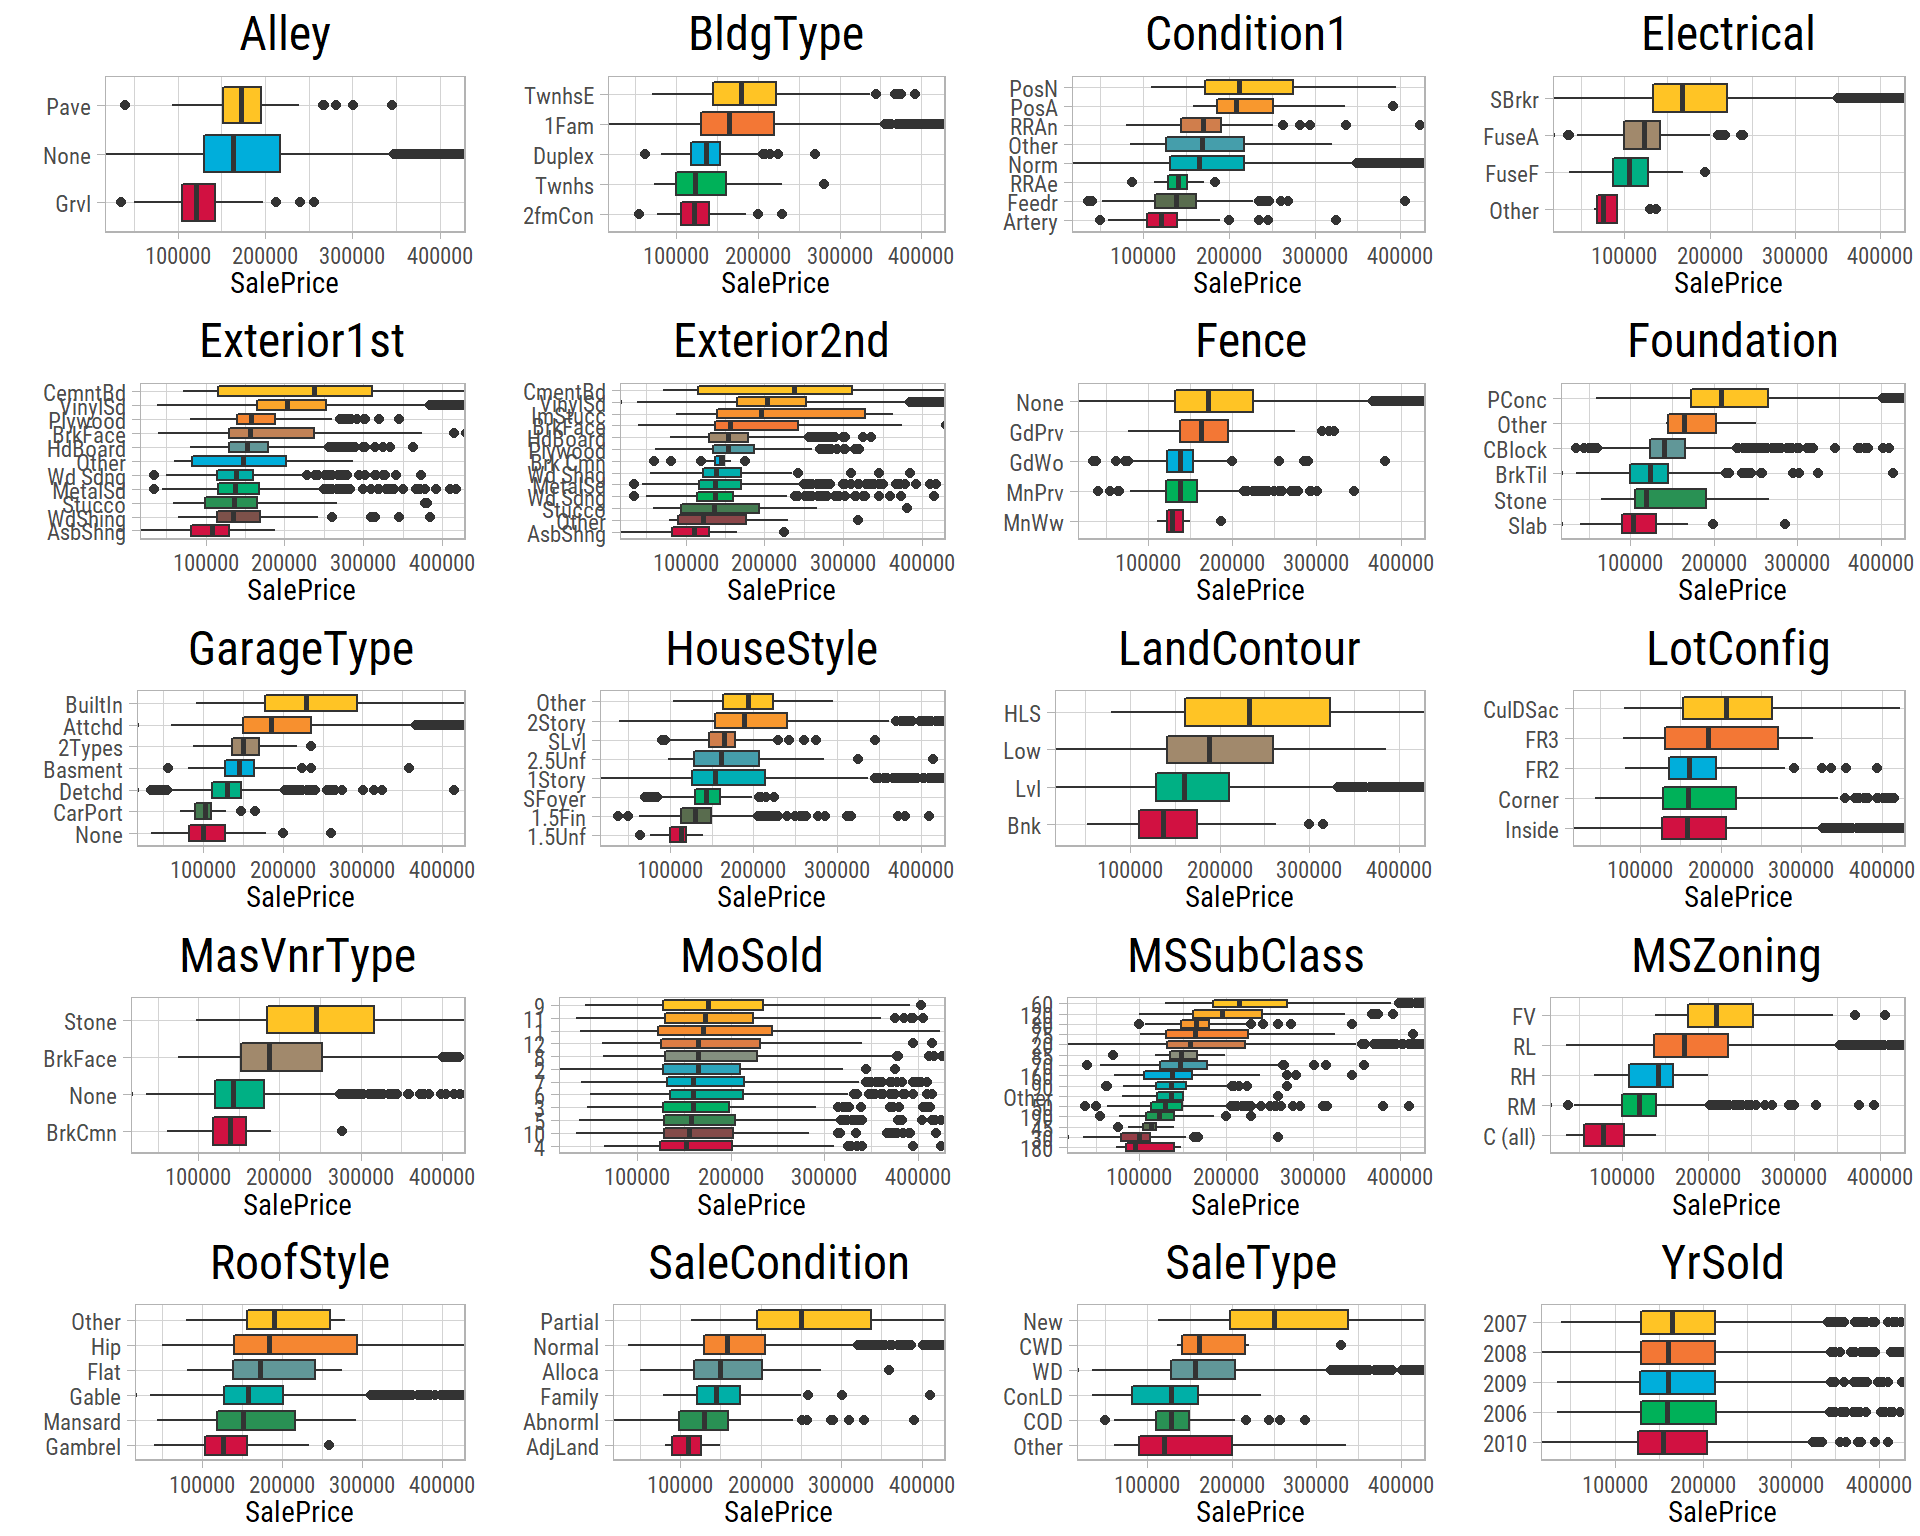
What’s notable?
GarageType: Builtin and attached garages are more preferred than detached or other types of garages.- From
MSSubClasscategories, it is evident that 1946 or newer houses are higher priced than older houses.
Multivariate Analysis
We will check variation of some related features with SalePrice.
Numerical-Numerical-Categorical
We have determined TotalSF and GarageArea have among the strongest correlations with SalePrice. Let’s see how they vary by NeighborhoodType and GarageType respectively:
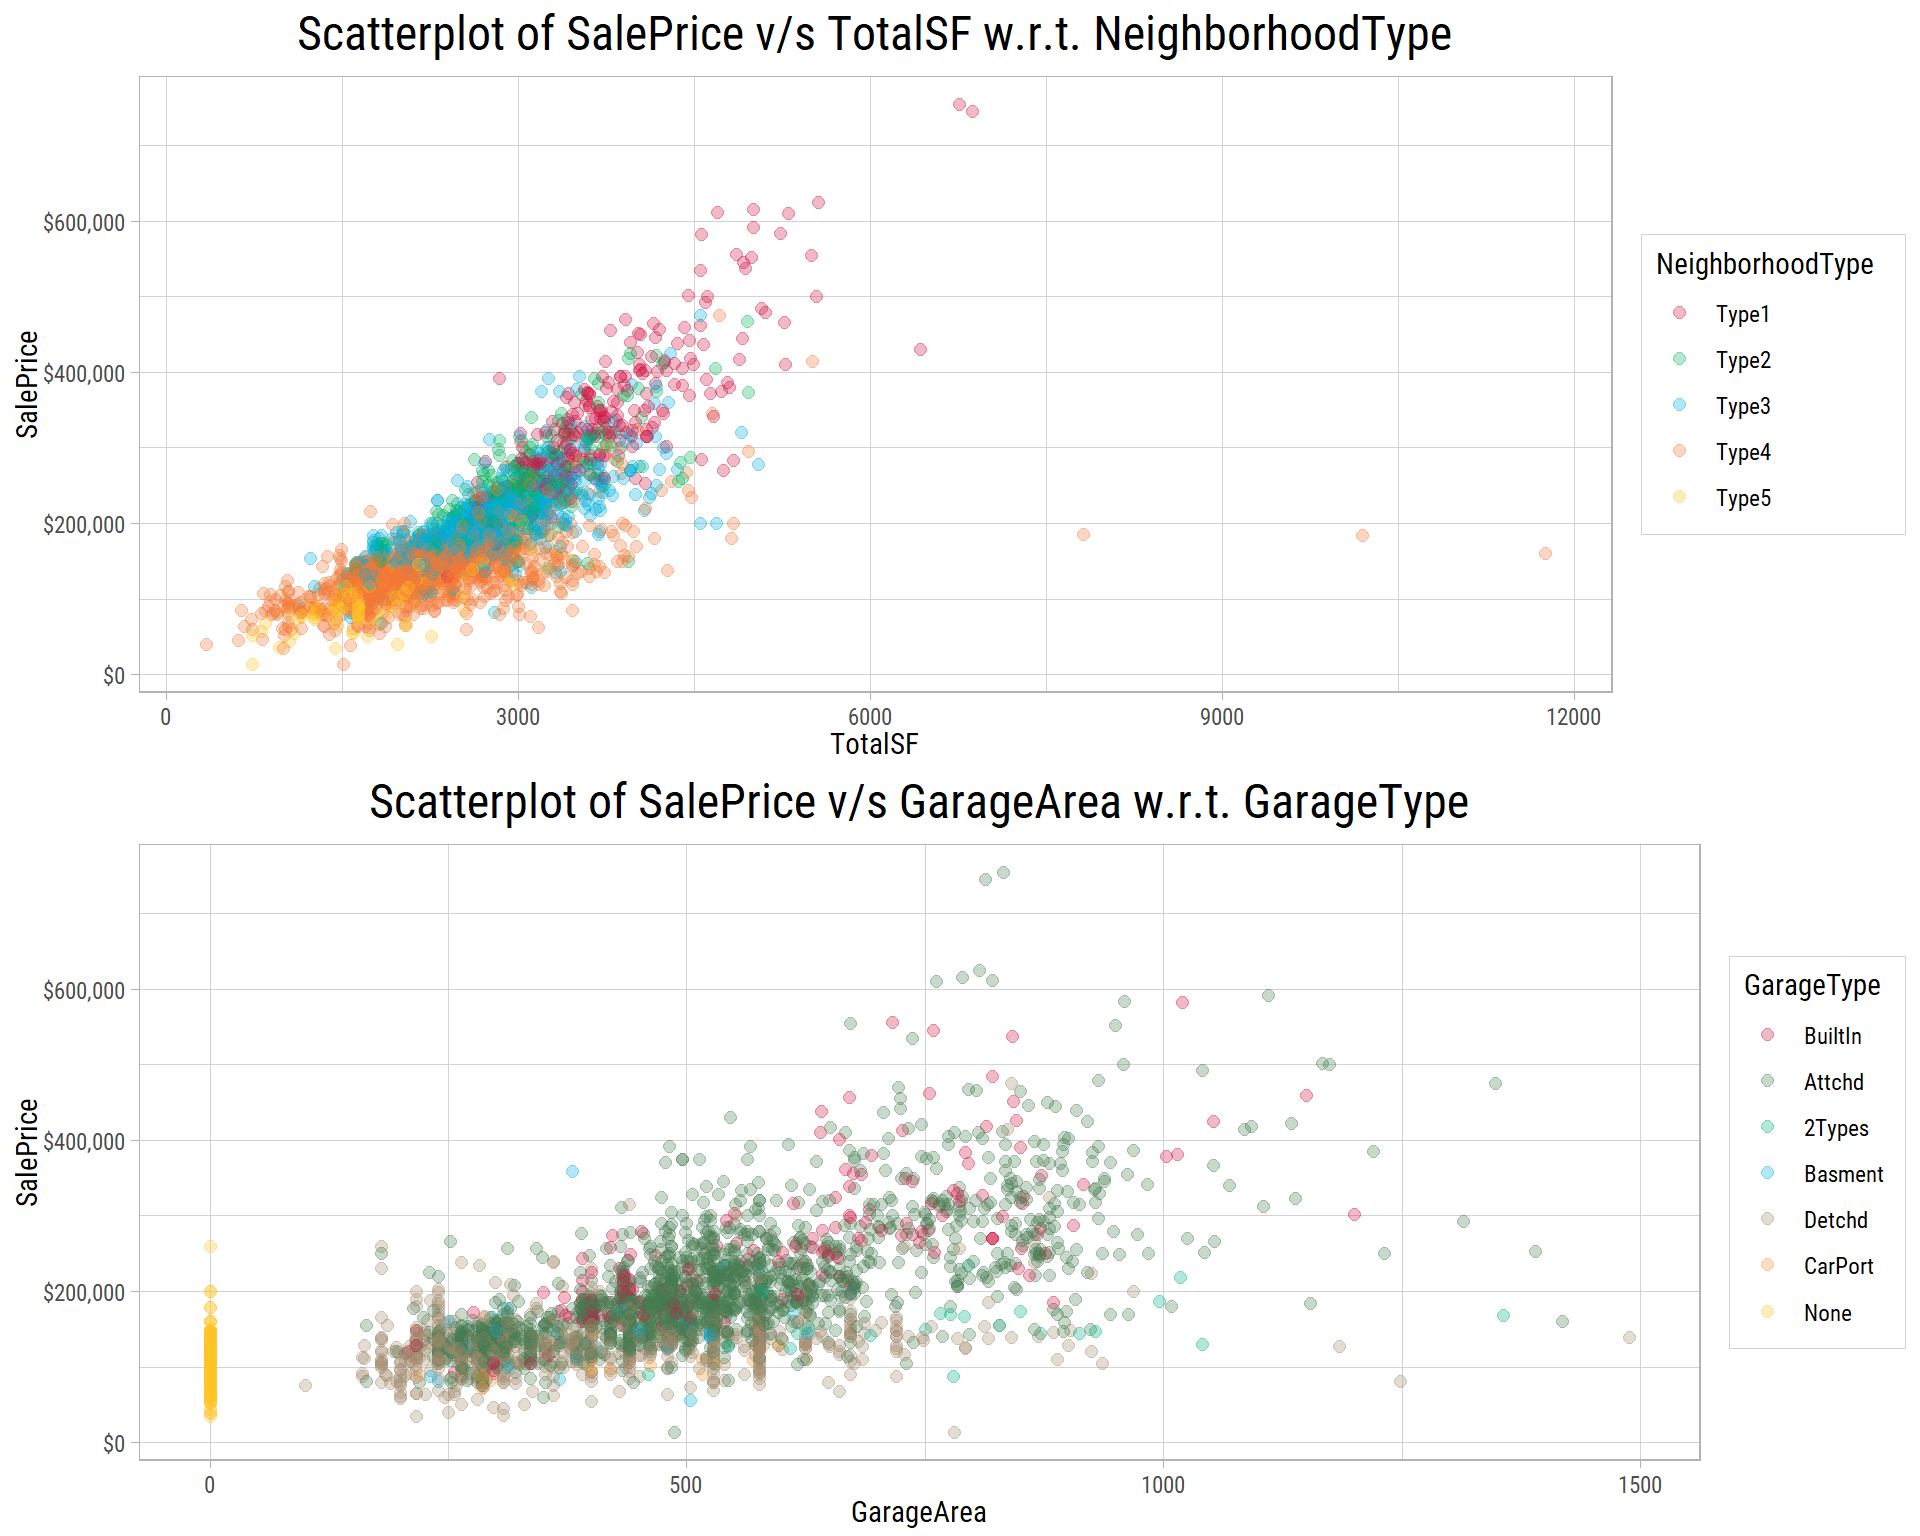
- For the same total area, there are neighborhoods where
SalePriceis higher than others. - Properties with no garage are distinctly separated.
- Properties with built-in or attached garages tend to have higher
SalePricefor the sameGarageArea. - Therefore,
NeighborhoodTypeandGarageTypeexplain some variance inSalePrice.
Categorical-Categorical-Numerical
We want to see if there is any interaction of SalePrice with a combination of categorical features, that could provide any additional explanatory power for prediction:
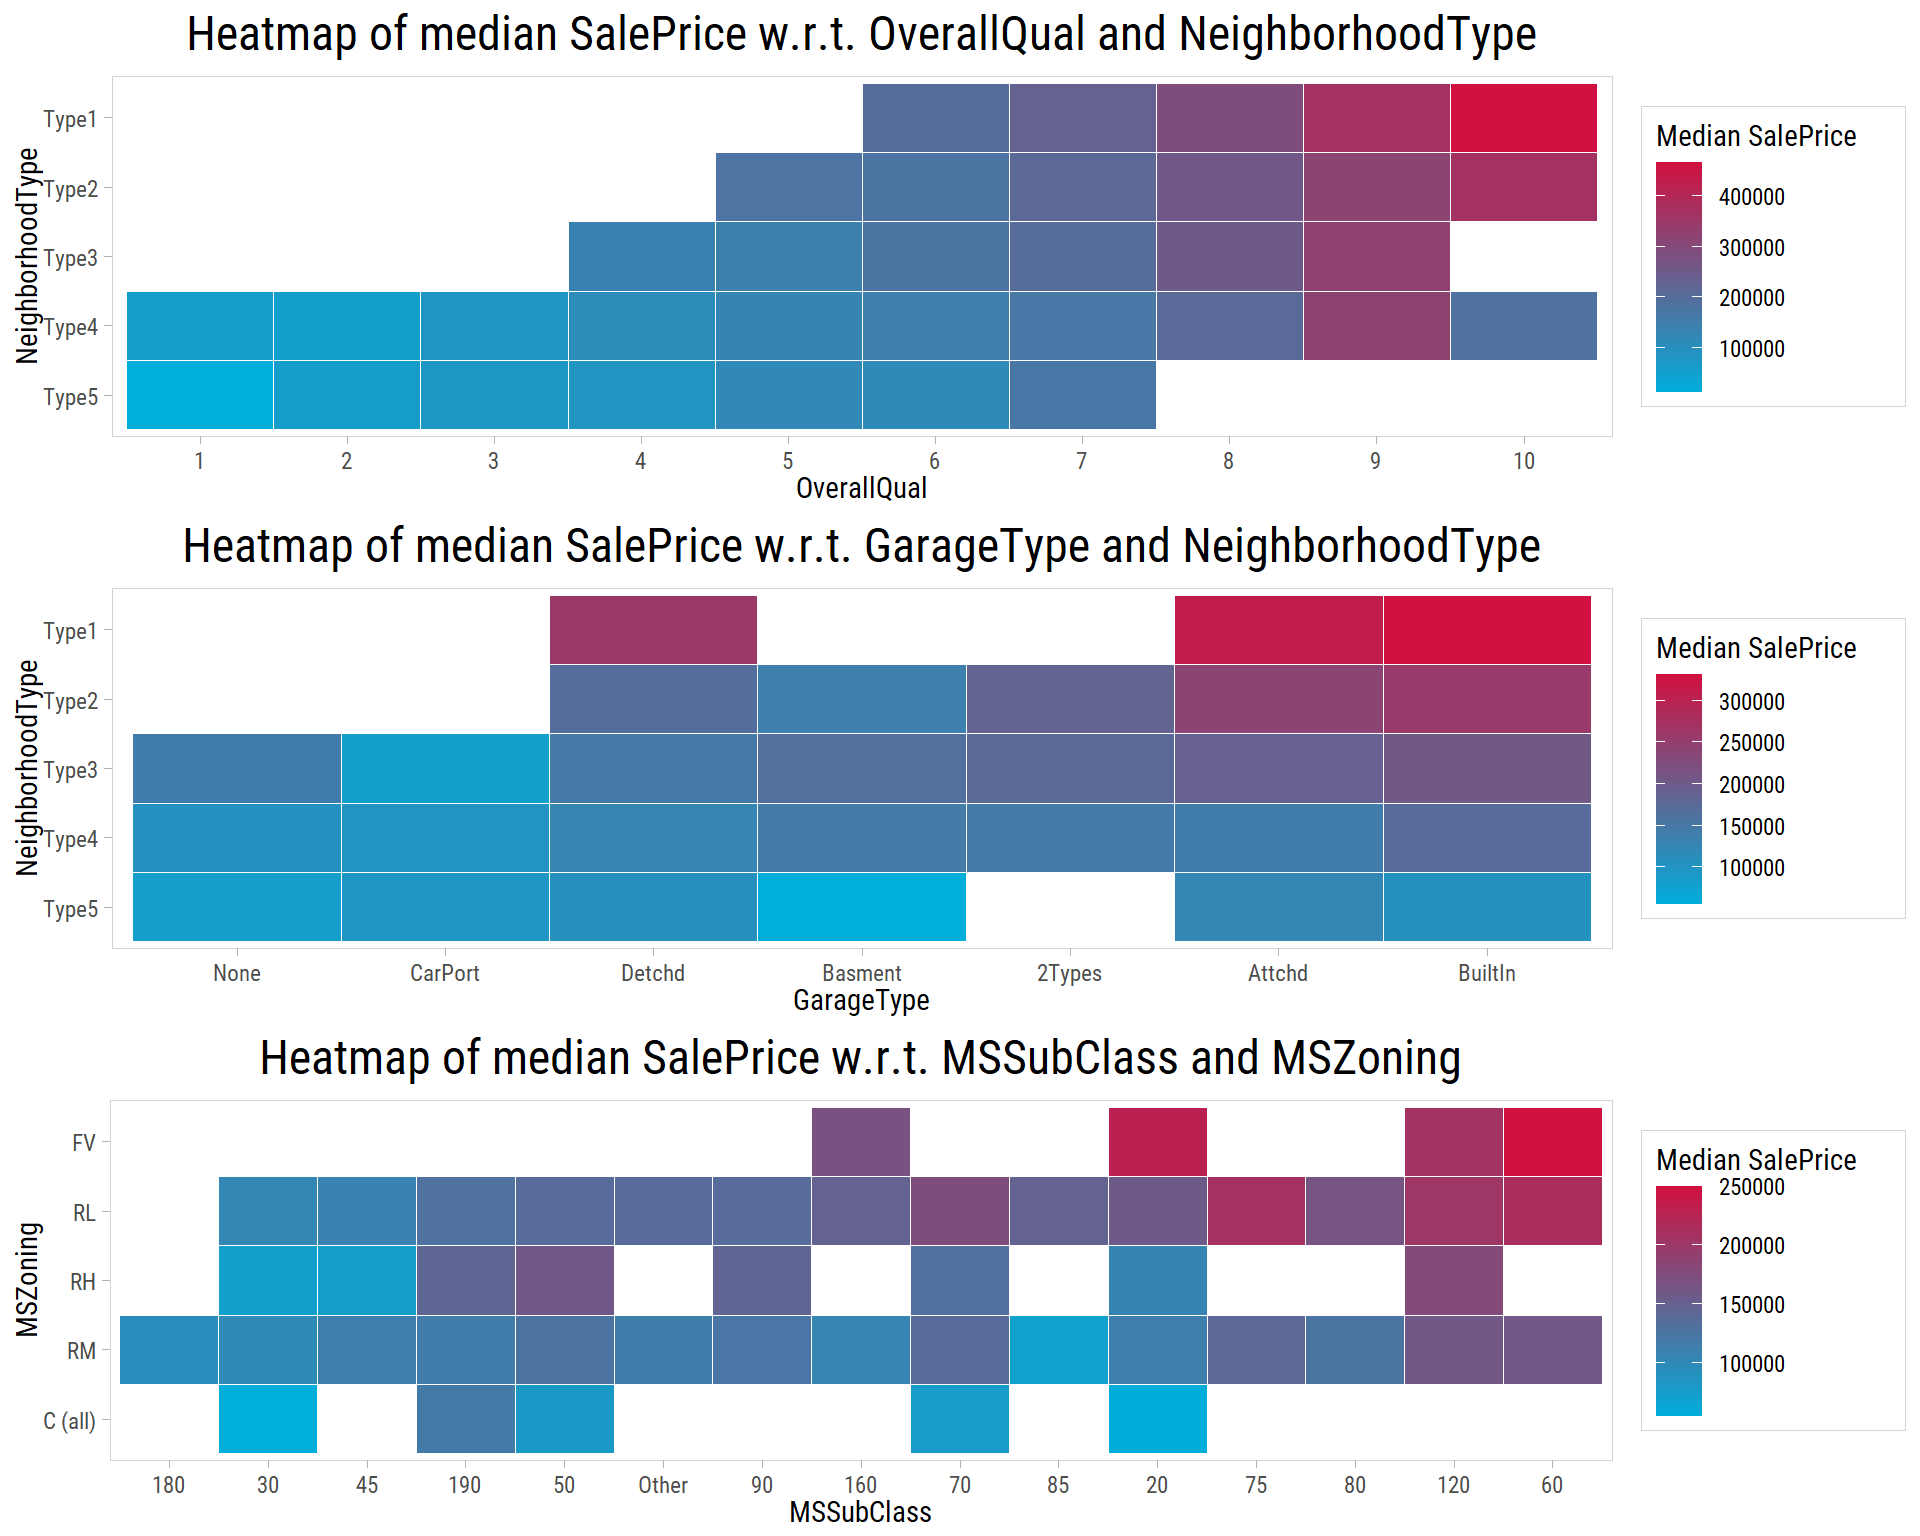
- It is evident that some neighborhoods have higher
OverallQualand therefore command higher price. However in Type4 neighborhoods, we can see a clear variation inSalePriceby quality of property. - It is less clear if
GarageTypehas a major impact by itself. Even though built-in and attached garages seem to be preferred, most of the variation can be explained byNeighborhoodTypeitself. - Low density and floating village residential properties tend to be higher priced in both single and multi-storied properties built after 1946.