Best batsmen in cricket at present
Who’re the best batsmen in cricket today? Is there a way to define a set of objective criteria that provides an unbiased conclusion? In my last post, I selected a list of top batsmen in the history of cricket, by simply filtering all batsmen who have had a career batting average of 50 or more in any format. Prior to that I eliminated newcomers, specialist bowlers and unsuccessful players by another set of filters.
I got a list of 42 batsmen who have consistently performed well throughout their career. Now the question is how could we select the best of the best who have had the most well-rounded performances. A post on fivethirtyeight has been a strong inspiration to arrive at the answers below.
Best batsmen at present
To select current best batsmen we filter the list of top batsmen to include only the batsmen who are actively playing in all the 3 formats of the game.
This leaves us with only 6 batsmen who are currently playing in all the formats. They are AB de Villiers, HM Amla, JE Root, KS Williamson, SPD Smith, V Kohli. No surprises there as these batsmen are widely considered to be the best among the active players today. But instead of subjectively handpicking them, we arrived at this conclusion by applying some reasonable filters.
But how well-rounded are these players? To determine this I’ve defined the following criteria and metrics:
| Criteria | Metric | Label |
|---|---|---|
| Consistency of scoring runs | Career batting average | SCORING CONSISTENCY |
| Ability to score quickly | Strike Rate | STRIKE RATE |
| Ability to score big (number of 100s + number of 50s scored) | Big scores per innings | BIG SCORING RATE |
| Overall contribution to the matches played | Team Win-Loss Ratio | WIN RATIO |
| Direct contribution to matches won | Batting average in winning matches | WIN CONTRIBUTION |
Every metric defined here is a ratio instead of an absolute number. So it is useful to evaluate relative ability.
Among the 42 top batsmen selected before, I calculate percentile scores of these metrics for each batsman grouped by the format of the game. This means we have a score ranging from 0-100 for each metric, where each batsman in the list has been scored relative to the best batsman in each criteria.
Let’s see the percentile scores for the 6 champion batsmen in our final list.
| Format | Country | Player | PercAverage | PercStrikeRate | PercInningsPerBigScore | PercWinRatio | PercAverageInWins | |
|---|---|---|---|---|---|---|---|---|
| 1 | Tests | South Africa | AB de Villiers | 20 | 57 | 27 | 61 | 47 |
| 2 | ODIs | South Africa | AB de Villiers | 100 | 100 | 86 | 72 | 93 |
| 3 | T20Is | South Africa | AB de Villiers | 36 | 73 | 31 | 88 | 32 |
| 4 | Tests | South Africa | HM Amla | 8 | 40 | 22 | 74 | 30 |
| 5 | ODIs | South Africa | HM Amla | 83 | 90 | 93 | 79 | 83 |
| 6 | T20Is | South Africa | HM Amla | 59 | 62 | 62 | 44 | 50 |
| 7 | Tests | England | JE Root | 54 | 70 | 81 | 20 | 86 |
| 8 | ODIs | England | JE Root | 76 | 73 | 89 | 15 | 86 |
| 9 | T20Is | England | JE Root | 89 | 67 | 70 | 32 | 75 |
| 10 | Tests | New Zealand | KS Williamson | 32 | 44 | 76 | 15 | 76 |
| 11 | ODIs | New Zealand | KS Williamson | 69 | 69 | 82 | 29 | 75 |
| 12 | T20Is | New Zealand | KS Williamson | 71 | 50 | 77 | 75 | 63 |
| 13 | Tests | Australia | SPD Smith | 98 | 83 | 86 | 37 | 91 |
| 14 | ODIs | Australia | SPD Smith | 56 | 83 | 52 | 75 | 58 |
| 15 | T20Is | Australia | SPD Smith | 18 | 45 | 8 | 57 | 19 |
| 16 | Tests | India | V Kohli | 10 | 79 | 8 | 64 | 18 |
| 17 | ODIs | India | V Kohli | 94 | 97 | 97 | 65 | 97 |
| 18 | T20Is | India | V Kohli | 100 | 84 | 93 | 94 | 94 |
Here we can see how each champion scored relative to the rest of the elite group. AB de Villiers has the best career batting average and strike rate in ODIs so he gets a score of 100 in SCORING CONSISTENCY & STRIKE RATE. All other batsmen are scored relative to AB in these 2 criteria. With his astounding batting average of 99.94 in Tests, Sir Don Bradman gets a score of 100 in SCORING CONSISTENCY in Tests. And being at number 5 in all time highest batting averages in Tests, Steve Smith gets a high score of 91 in this criteria, relative to Sir Don.
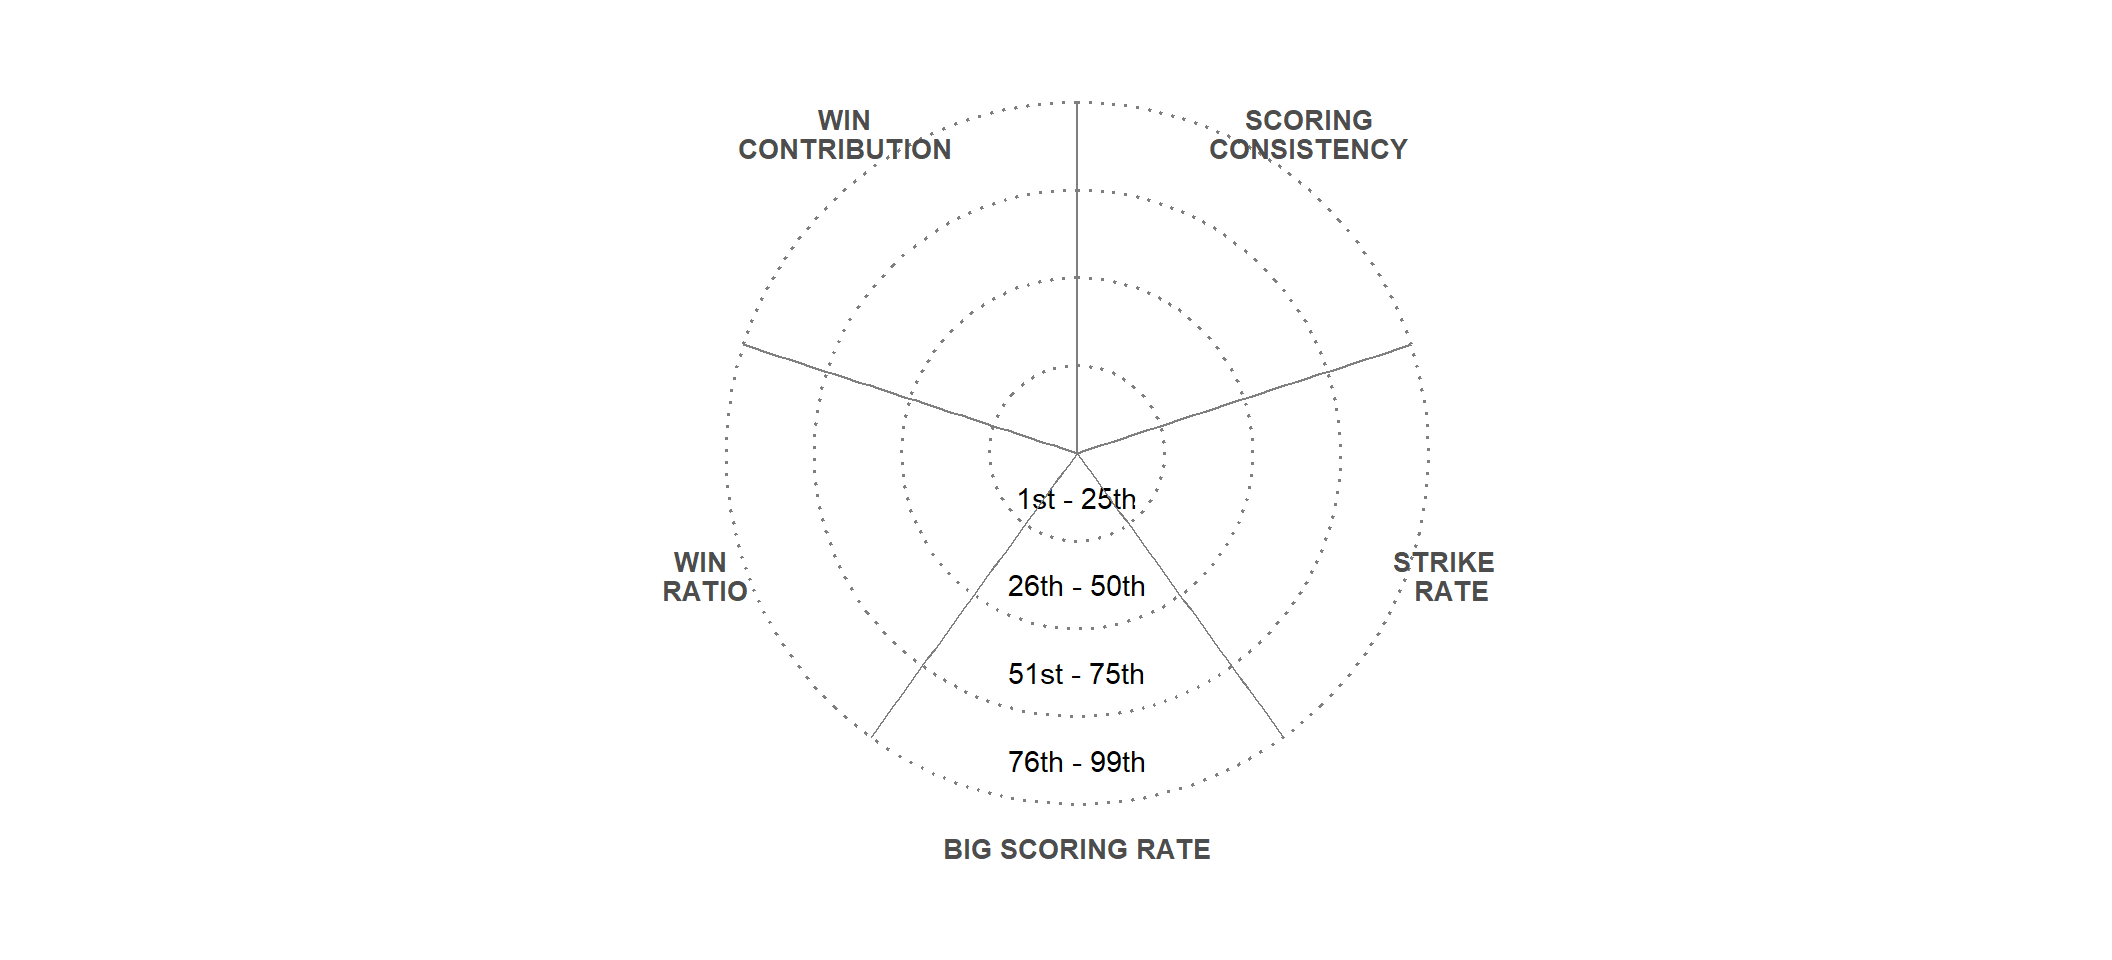
This is all well and good, but how do we see the forest from trees? It is very difficult to make sense of high dimensional data in a table or in a single bar plot. This is where the visualization technique shown in the fivethirtyeight article shines. We build a wagon wheel with segments denoting each metric and within each segment, the data is binned by quartiles.
Here’s how a wagon wheel would look like for each batsman. Each segment would be filled depending upon the percentile score in each criteria.
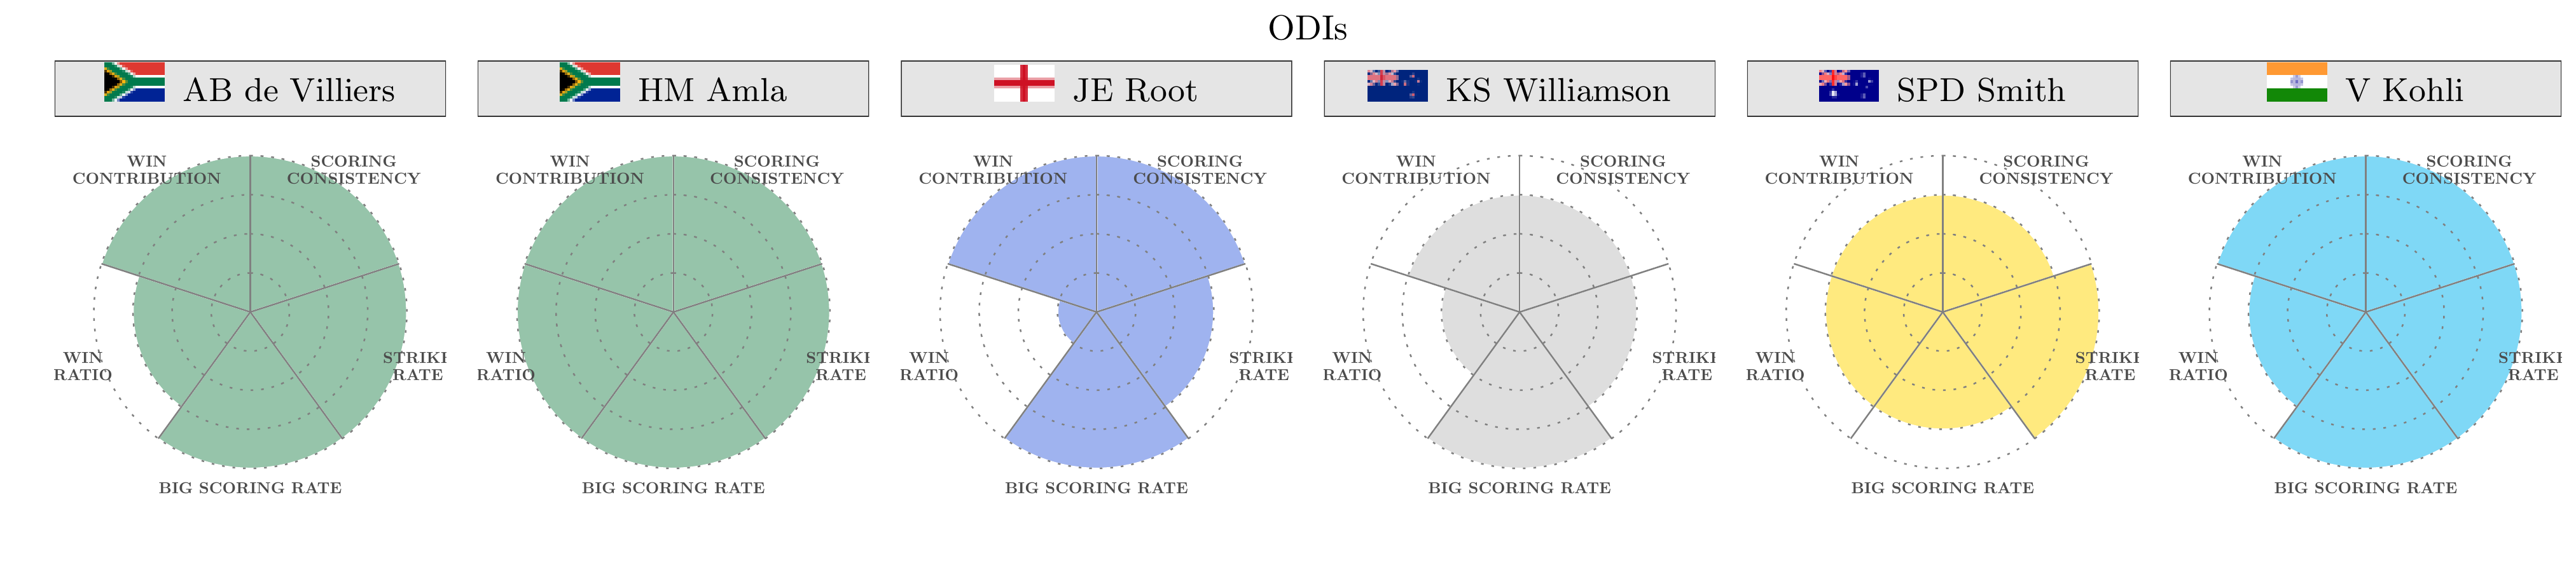
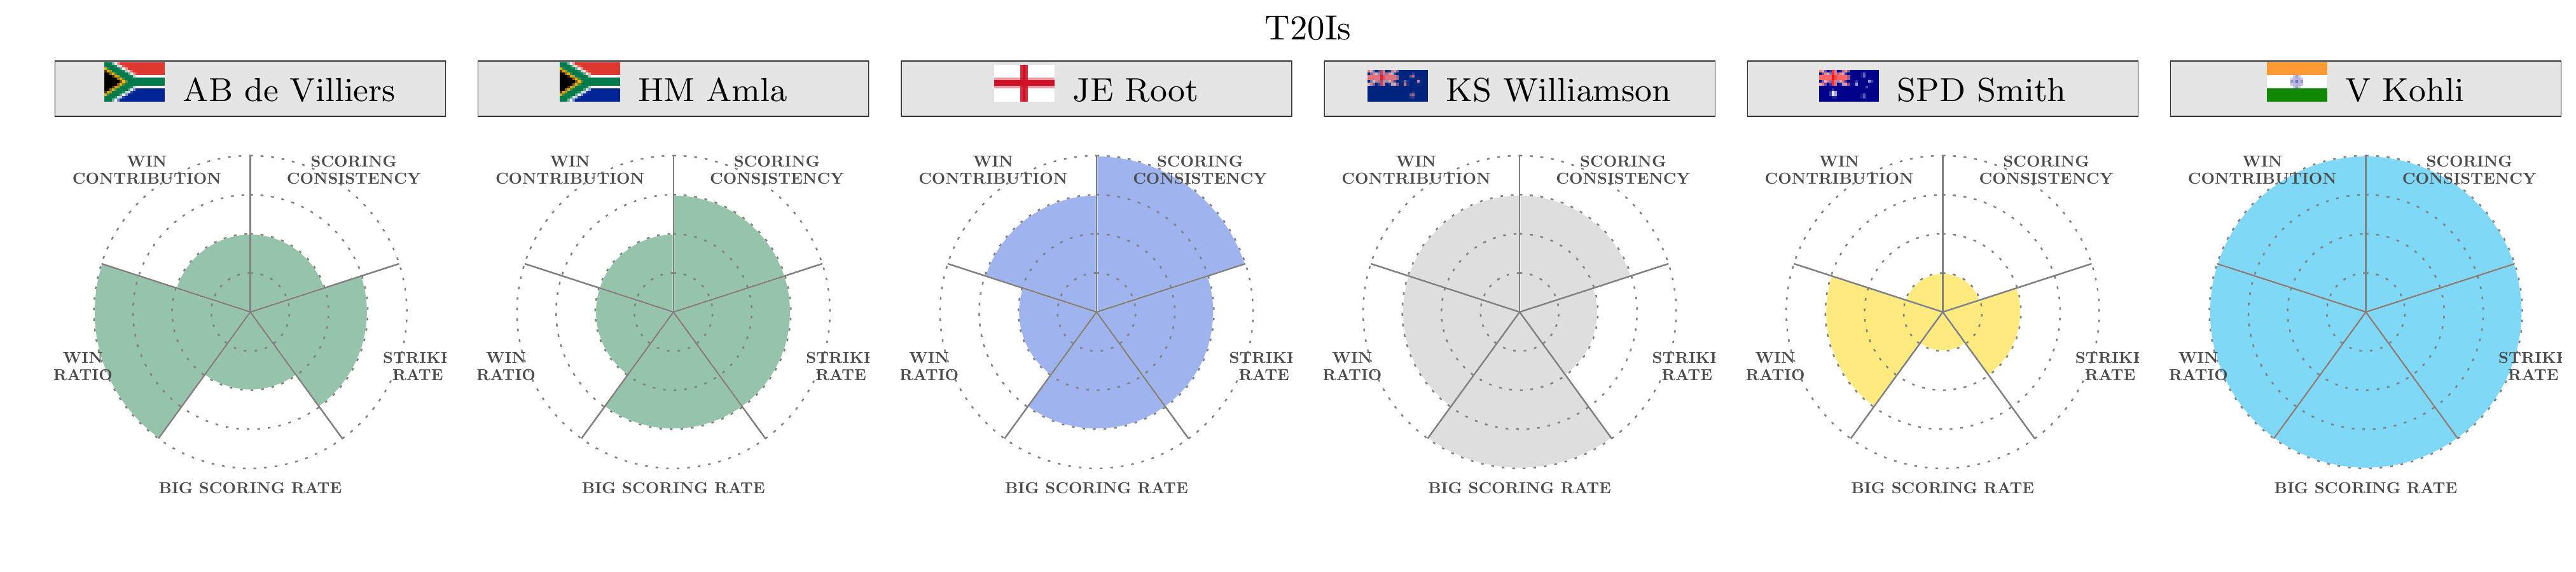
So let’s see how the wagon wheels of our champions look like:
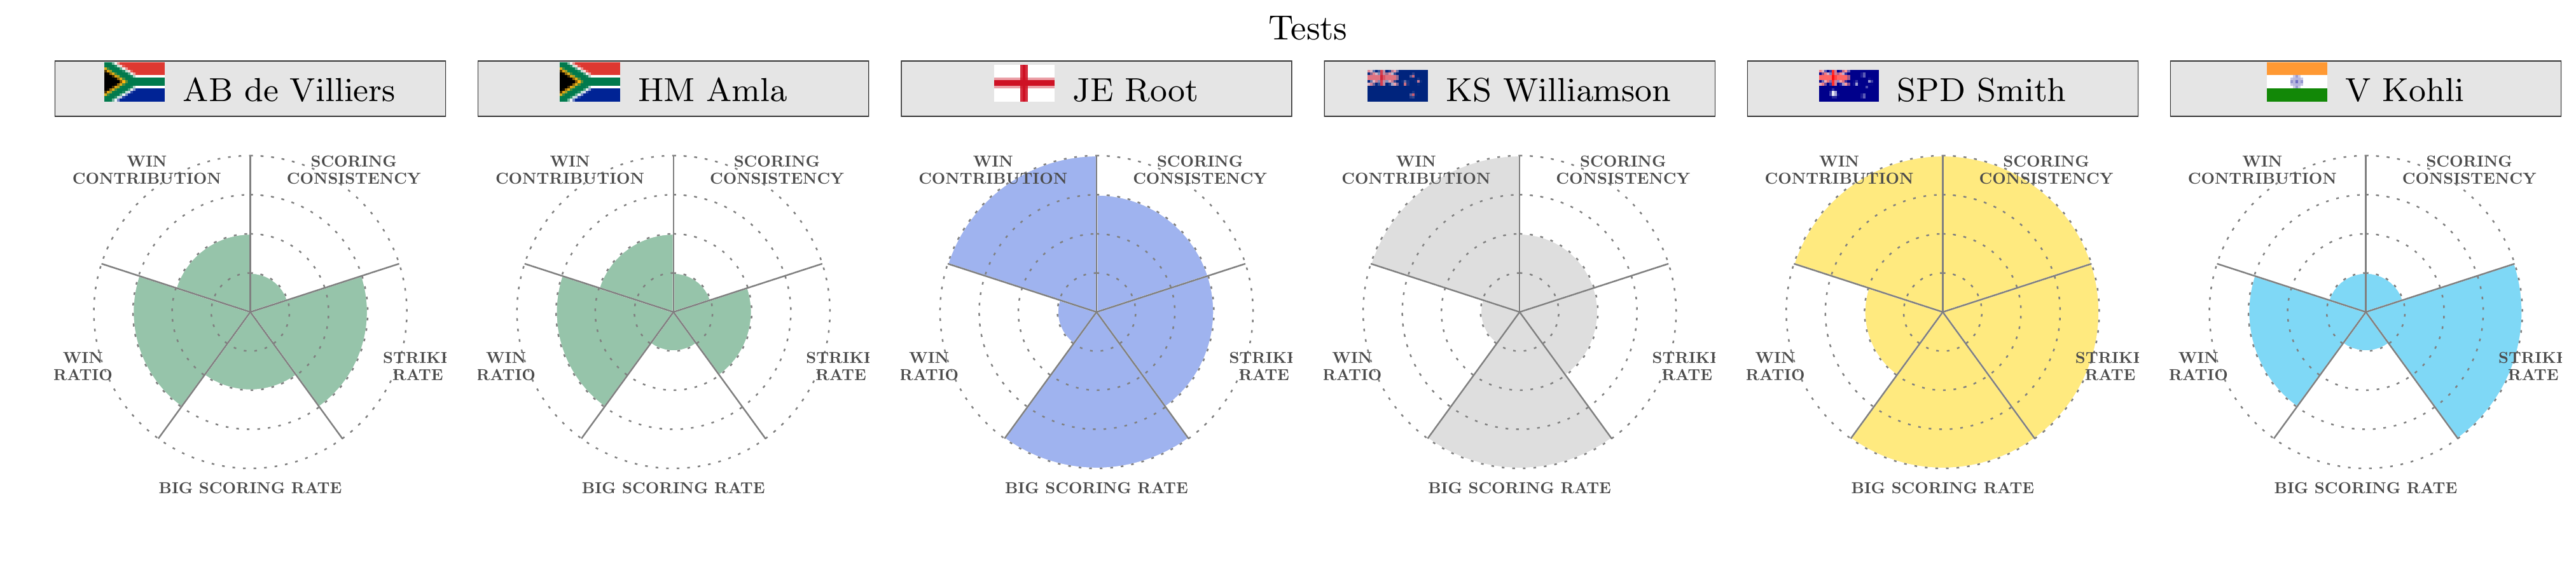
We see that Steve Smith is the most well-rounded batsman in Tests. His WIN RATIO is lacking relative to the illustrious company he’s in, but overall his performance in Tests is phenomenal. Joe Root comes second but others have a bit more catching up to do.
In One Day Internationals, Hashim Amla dominates in all spheres with AB de Villiers and Virat Kohli not far behind. Joe Root seems to contribute in most matches won by England but it appears the English team loses a fair bit in ODIs. Hence the WIN RATIO of Root is a bit lacking.
Virat Kohli is the undisputed king in the T20 Internationals format with Kane Williamson in second place. Steve Smith’s performance so far leaves much to be desired in this format.
The beauty of this visualization technique is that several dimensions in the data are compressed in a single facetted plot, in a visually appealing way. A glance at the plot reveals the relative best, both overall and in each metric.