Investment Strategy Diversification
By all conventional and even some unconventional measures, the US stock market is trading way beyond historical valuation averages and is closer to all time highs. Passive stock index investors have enjoyed a period of extraordinary gains in one of the longest running bull markets. No other major asset class has come close in the last 7 years. Well diversified portfolios have had lackluster returns while the stock market keeps making new highs.
| Table 1: Performance by Asset Class | ||||||||
| US Stocks | Foreign Stocks | US Bonds | Foreign Bonds | Treasuries | Gold | Commodities | REITs | |
|---|---|---|---|---|---|---|---|---|
| 7 Years | ||||||||
| May 2010 - Apr 2017 Annualized Return | 12.72% | 4.47% | 3.36% | 0.79% | 7.28% | 0.66% | -6.91% | 11.09% |
| 5 Years | ||||||||
| May 2012 - Apr 2017 Annualized Return | 13.54% | 5.40% | 2.23% | -0.61% | 3.53% | -5.69% | -12.23% | 9.16% |
| 3 Years | ||||||||
| May 2014 - Apr 2017 Annualized Return | 10.35% | 1.09% | 2.64% | -3.14% | 5.95% | -0.93% | -17.55% | 8.82% |
But overstretched valuations in a contentious political climate raise fears of what’s around the corner. Small market gains accumulated gradually over months could be wiped out within days or weeks, when the sentiment turns. So what should investors do?
Momentum strategies provide an attractive alternative in this scenario. Momentum has been described as a premier market anomaly. Studies have been published for over 2 decades showing why and how well it works. Despite being well publicized in the investment world, momentum strategies have continued to work well over long periods of time.
Some of the biggest advantages of momentum strategies are:
- Their entry and exit rules could be well-defined and understood
- They could be implemented using highly liquid, low cost ETFs
- They are relatively easier to scale and execute
- During market downturns, these strategies exhibit lower volatilities and drawdowns as compared to value and passive investing strategies
That being said, momentum is not a single monolithic strategy as many academics portray it to be. It could be implemented in many different ways. Here I present three momentum strategies that could be combined in simple ways to mitigate overall volatility and drawdowns, while maintaining attractive returns.
Global Equities Momentum Strategy
The first of these is Global Equities Momentum (“GEM”), which has been detailed by Gary Antonacci in his fantastic book, Dual Momentum Investing. It is one of the simplest strategies to understand and implement. GEM effectively makes use of zero correlation betweeen stocks and bonds. It utilizes absolute momentum to switch to bonds when stocks show weak performance, and bonds tend to do well. Additionally, it uses relative momentum to switch between domestic and foreign stocks during times of stock market strength.
Here are the concrete rules, dataset and assumptions to backtest GEM:
Rules : Between domestic and foreign equities, invest in the one which had higher outperformance relative to the risk free rate in the past 12 months. Otherwise invest in bonds.
Dataset : Total returns calculated from daily adjusted closing prices downloaded from Yahoo! Finance
- Domestic stocks (SPY, combined with VFINX prior to Feb 1993)
- Foreign stocks (CWI, combined with VGTSX prior to Jan 2007)
- Bonds (AGG, combined with VBMFX prior to Oct 2003)
- Risk free rate determined by T-bills data downloaded from FRED.
Assumptions : Signals and weights determined at the end of month (t), rebalanced at the end of first business day of next month (t+1), transaction costs 20 bps per trade.
| Table 2: Comparison of GEM strategy with an equally weighted portfolio of SPY, CWI and AGG | ||||
| SP500TR | GEM_Antonacci | GEM | EqualWts | |
|---|---|---|---|---|
| May 1997 - Apr 2017 Annualized Return | 7.52% | 12.66% | 11.79% | 6.24% |
| May 1997 - Apr 2017 Annualized Std Dev | 15.17% | 11.93% | 11.97% | 10.68% |
| May 1997 - Apr 2017 Annualized Sharpe (Rf=2.04%) | 0.35 | 0.87 | 0.80 | 0.38 |
| May 1997 - Apr 2017 Worst Drawdown | -50.95% | -17.84% | -19.32% | -38.77% |
It is easy to cross-check the backtesting results with simulated results from Gary’s website. I do not expect to match the annualized returns as Gary’s simulations use theoretical indexes, do not apply any fees or transaction costs, and monthly performance numbers on his website are rounded to the first decimal place. But a correlation of monthly returns of 0.99, annualized standard deviations, shape of the equity curves and the close alignment of drawdowns all suggest a close match.
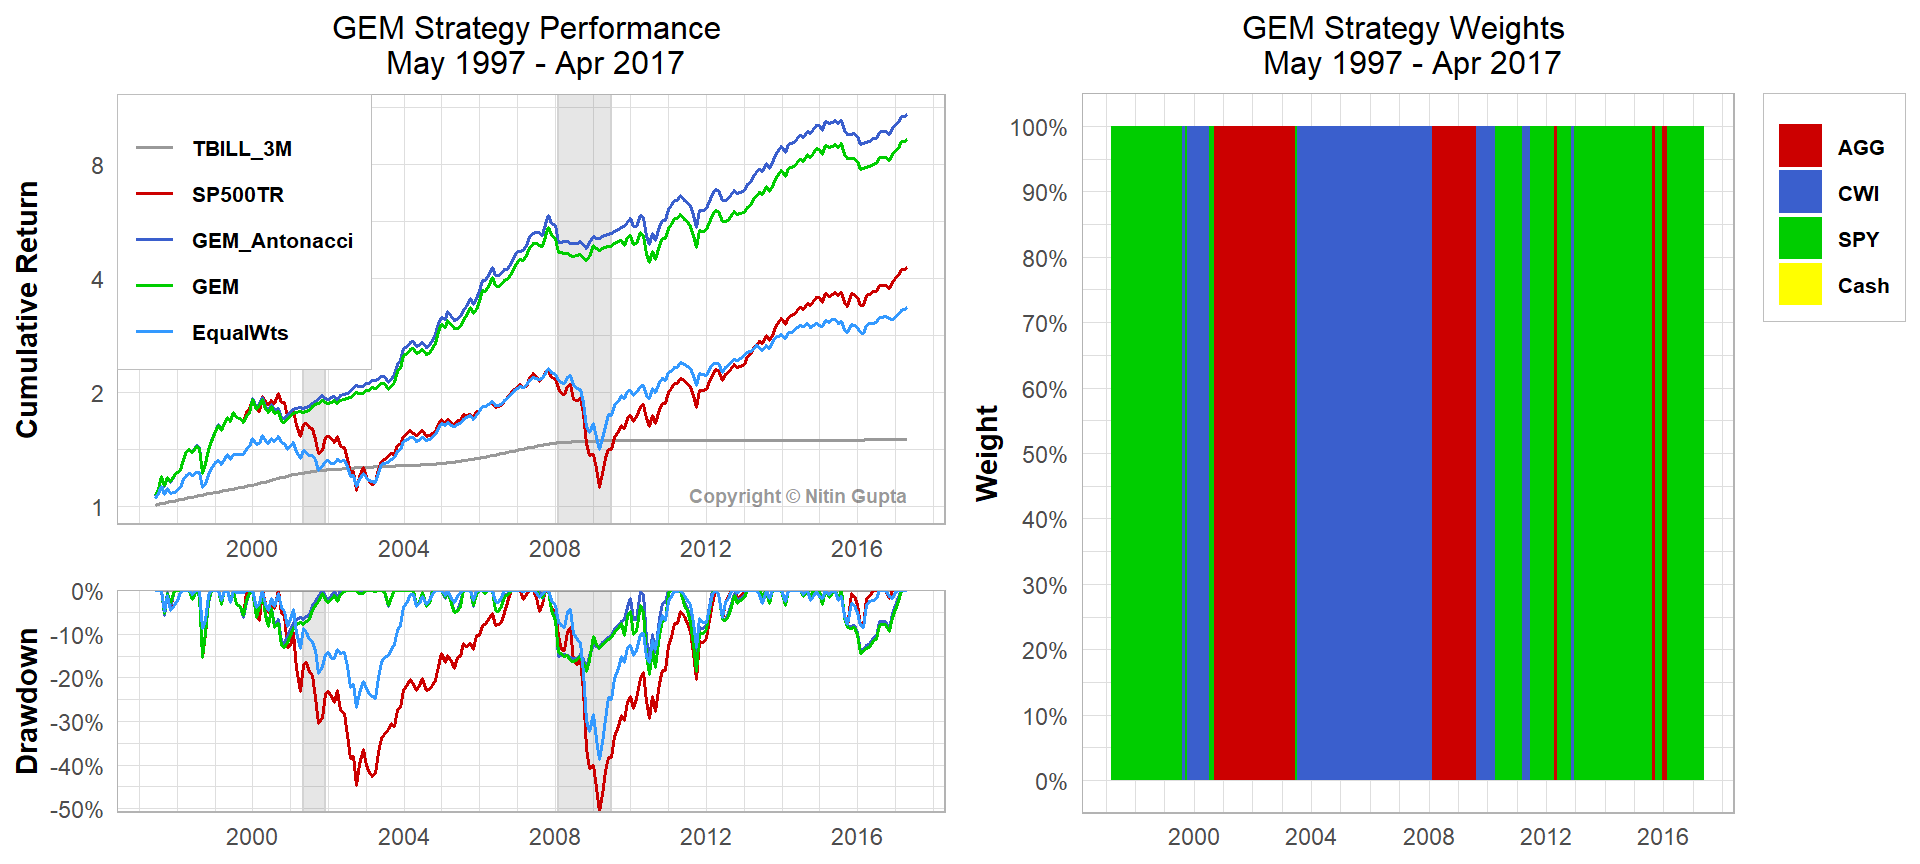
The GEM strategy performance shows simple rules could be used for timing entries and exits and work exceedingly well over complete market cycles. GEM trounces the S&P 500 Total Returns Index on both absolute and risk adjusted basis over 2 market cycles in this backtesting period.
The results of an equally weighted long only strategy of SPY, CWI and AGG are also shown. Essentially it’s a simplified and slightly aggressive 66.67% stocks and 33.33% bonds portfolio, which gives a sense of the performance of a passive structurally allocated portfolio strategy. As compared to the broader market, it does reduce the volatility but a worst drawdown of ~ 40% is still driven by stocks.
The edge provided by simple market timing rules in GEM is evident as compared to an equally weighted long only portfolio of the 3 underlying assets. The drawdowns are much lower as there’s a clear rule for exiting the market when it underperforms relative to the risk free rate. Moreover, there have been very few trades over the past 20 years, and most of the gains have been long term in nature. Hence GEM is quite attractive from a tax standpoint too.
SPY-TLT Universal Investment Strategy
This strategy has been detailed on LogicalInvest. It utilizes just 2 asset classes, stocks and long term treasuries, and takes advantage of a slighly inverse correlation between the two. While GEM rotates between stocks and bonds in a 100% risk-on / risk-off manner, this strategy is more nuanced. It rotates between stocks and long term treasuries in a more measured way. It selects between a mix of stocks and treasuries which has performed the best on a risk-adjusted basis, in the recent past.
Here are the concrete rules, dataset and assumptions to backtest UIS:
Rules : Construct 11 portfolios ranging from 100% SPY, 0% TLT to 0% SPY, 100% TLT, by successively incrementing the weight of TLT by 10%. Determine the returns and volatility of these 11 portfolios in the past 60 days (~ 3 months). Select the portfolio that gives the best risk adjusted returns in this period and apply the same weights to the following month.
Dataset : Total returns calculated from daily adjusted closing prices downloaded from Yahoo! Finance
- Stocks (SPY, combined with VFINX prior to Feb 1993)
- Long-term Treasuries (TLT, combined with VUSTX prior to Aug 2002).
Assumptions : Weights determined at the end of month (t), rebalanced at the end of first business day of next month (t+1), transaction costs 20 bps per trade.
| Table 3: Comparison of UIS strategy with an equally weighted portfolio of SPY and TLT | |||
| SP500TR | UIS | EqualWts | |
|---|---|---|---|
| Sep 1986 - Apr 2017 Annualized Return | 10.01% | 11.46% | 9.12% |
| Sep 1986 - Apr 2017 Annualized Std Dev | 14.99% | 11.22% | 8.83% |
| Sep 1986 - Apr 2017 Annualized Sharpe (Rf=3.23%) | 0.44 | 0.71 | 0.64 |
| Sep 1986 - Apr 2017 Worst Drawdown | -50.95% | -23.51% | -22.35% |
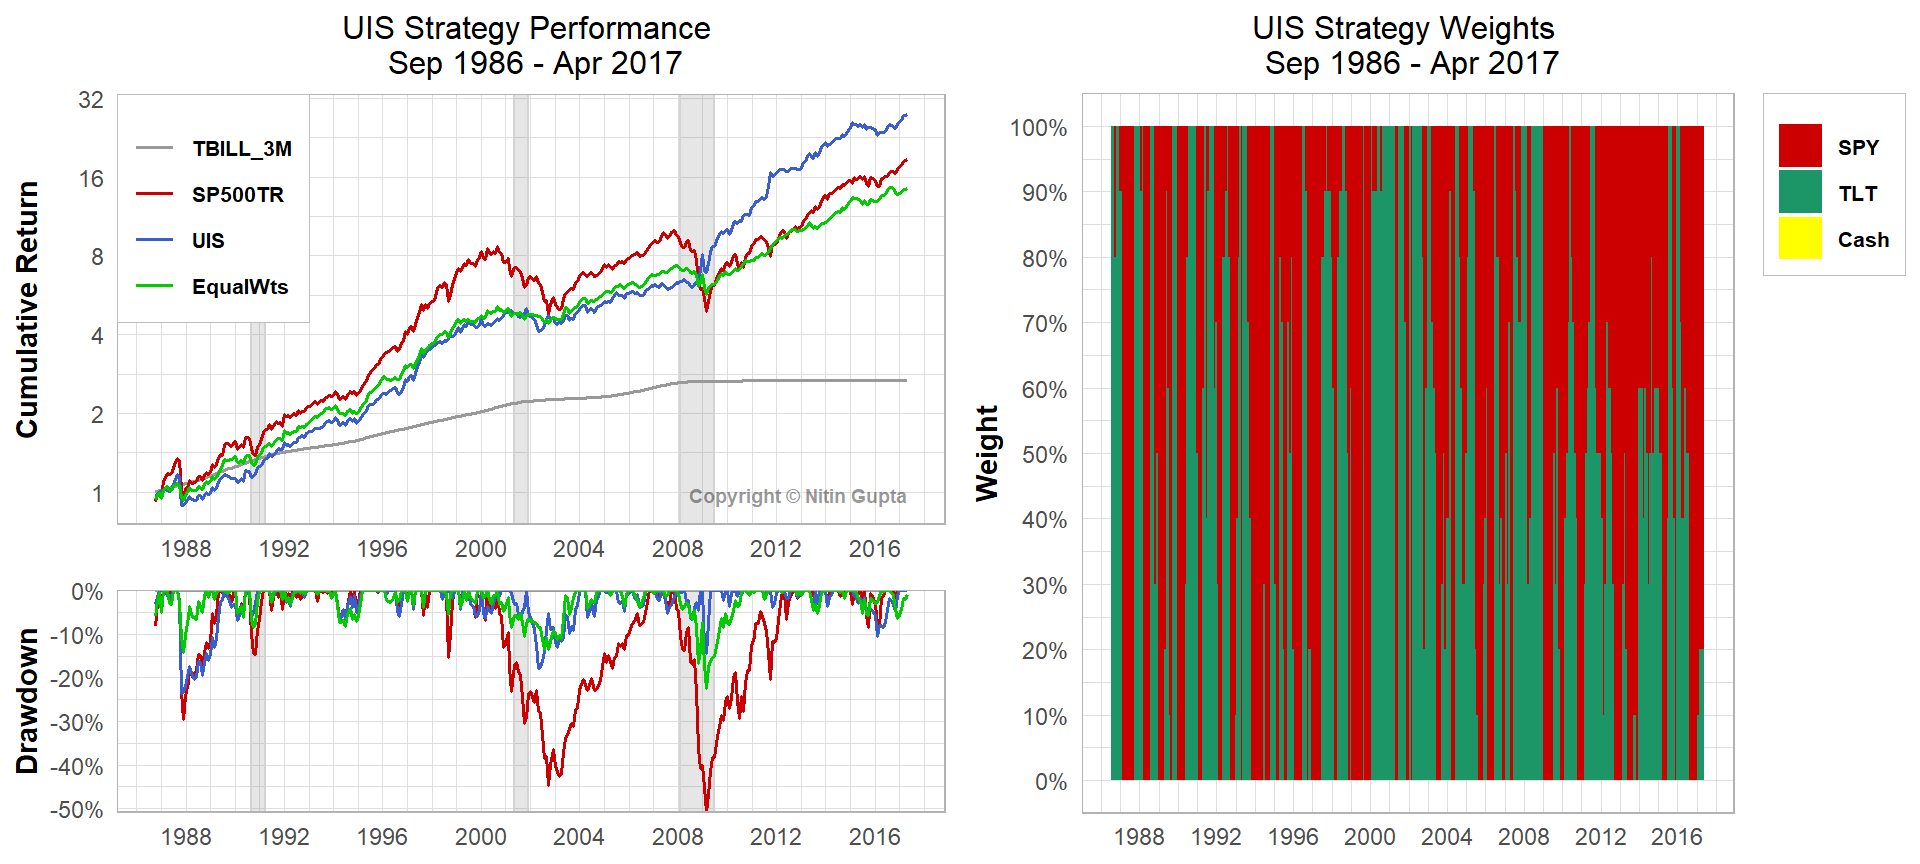
The performance of both UIS and an equally weighted long only mix of stocks and treasuries show the benefits of diversication between these 2 asset classes. In fact an equally weighted portfolio would’ve done just about as well as the S&P 500 Total Returns Index with far lower volatility and drawdowns. Since the global financial crisis of 2008, UIS has performed exceedingly well, which has led to its outperformance on both absolute as well as risk-adjusted basis.
Three-Way Momentum Strategy
This strategy is a more simplified version of a three-way momentum model posted by Meb Faber on his blog, that was originally done by Ned Davis Research. As Meb has suggested, it is conceptually similar to the strategies in his QTAA paper. This strategy is also one of the simplest to understand and implement. It utilizes just 3 asset classes: stocks, bonds and gold and invests equally in all asset classes that show positive momentum.
Here are the concrete rules, dataset and assumptions to backtest this strategy:
Rules : Invest equally in stocks, bonds and gold as long as they trade above their past 200 days moving average. If none of them trades above their 200 days moving average, then invest in T-bills.
Dataset : Total returns calculated from daily adjusted closing prices downloaded from Yahoo! Finance
- Stocks (SPY, combined with VFINX prior to Feb 1993)
- Bonds (AGG, combined with VBMFX prior to Oct 2003)
- Gold (GLD, combined with LBMA/GOLD prior to Nov 2004).
- Risk free rate determined by T-bills data downloaded from FRED.
Assumptions : Signals and weights determined at the end of month (t), rebalanced at the end of first business day of next month (t+1), transaction costs 20 bps per trade.
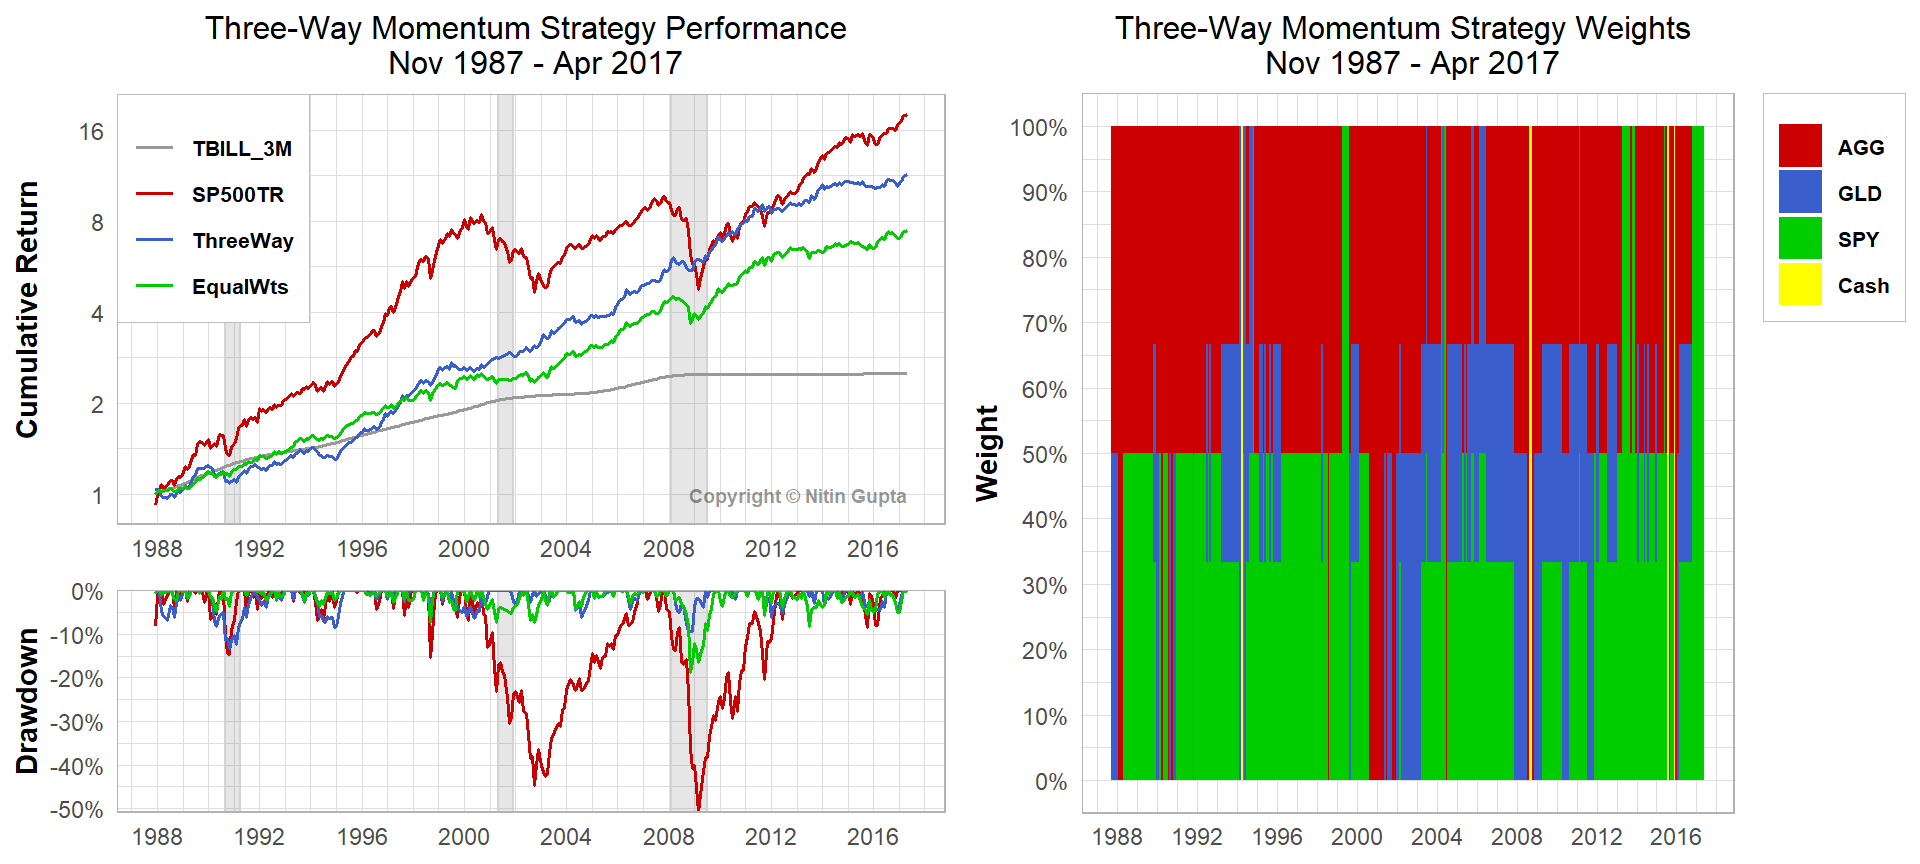
| Table 4: Comparison of Three-Way Momentum Strategy with an equally weighted portfolio of SPY, AGG and GLD | |||
| SP500TR | ThreeWay | EqualWts | |
|---|---|---|---|
| Nov 1987 - Apr 2017 Annualized Return | 10.31% | 8.60% | 7.05% |
| Nov 1987 - Apr 2017 Annualized Std Dev | 14.31% | 7.57% | 7.22% |
| Nov 1987 - Apr 2017 Annualized Sharpe (Rf=3.13%) | 0.48 | 0.70 | 0.52 |
| Nov 1987 - Apr 2017 Worst Drawdown | -50.95% | -13.34% | -18.71% |
Strategy Correlations
Although GEM works very well on its own, it is unlikely that the other two strategies could be followed on a stand-alone basis. Even the 100% risk-on / risk-off nature of GEM make it difficult to employ it at scale.
But let’s look at the correlations of these strategies:
| Table 5: Correlation of monthly returns (May 1997 to April 2017) | ||||
| SP500TR | GEM | UIS | ThreeWay | |
|---|---|---|---|---|
| SP500TR | 1.00 | 0.67 | 0.26 | 0.35 |
| GEM | 0.67 | 1.00 | 0.31 | 0.55 |
| UIS | 0.26 | 0.31 | 1.00 | 0.37 |
| ThreeWay | 0.35 | 0.55 | 0.37 | 1.00 |
The UIS strategy has low correlations with both GEM and the Three-Way strategy. Even GEM and the Three-Way Strategy have a correlation of ~ 0.55. So they could be effectively blended together to form a portfolio of diversified strategies.
Here are a couple of simple ways to blend these strategies:
Strategy Blends
In the last 20 years backtesting period, an equal weight combination of GEM and UIS results in a significant reduction in portfolio volatility without compromising returns. Hence the blended strategy gets a solid boost on risk adjusted returns.
| Table 6: Comparison of a blended strategy with 50% each of GEM & UIS strategies | ||||
| SP500TR | GEM | UIS | Equal_Blend | |
|---|---|---|---|---|
| May 1997 - Apr 2017 Annualized Return | 7.52% | 11.79% | 12.10% | 12.20% |
| May 1997 - Apr 2017 Annualized Std Dev | 15.17% | 11.97% | 11.15% | 9.38% |
| May 1997 - Apr 2017 Annualized Sharpe (Rf=2.04%) | 0.35 | 0.80 | 0.88 | 1.06 |
| May 1997 - Apr 2017 Worst Drawdown | -50.95% | -19.32% | -17.81% | -11.81% |
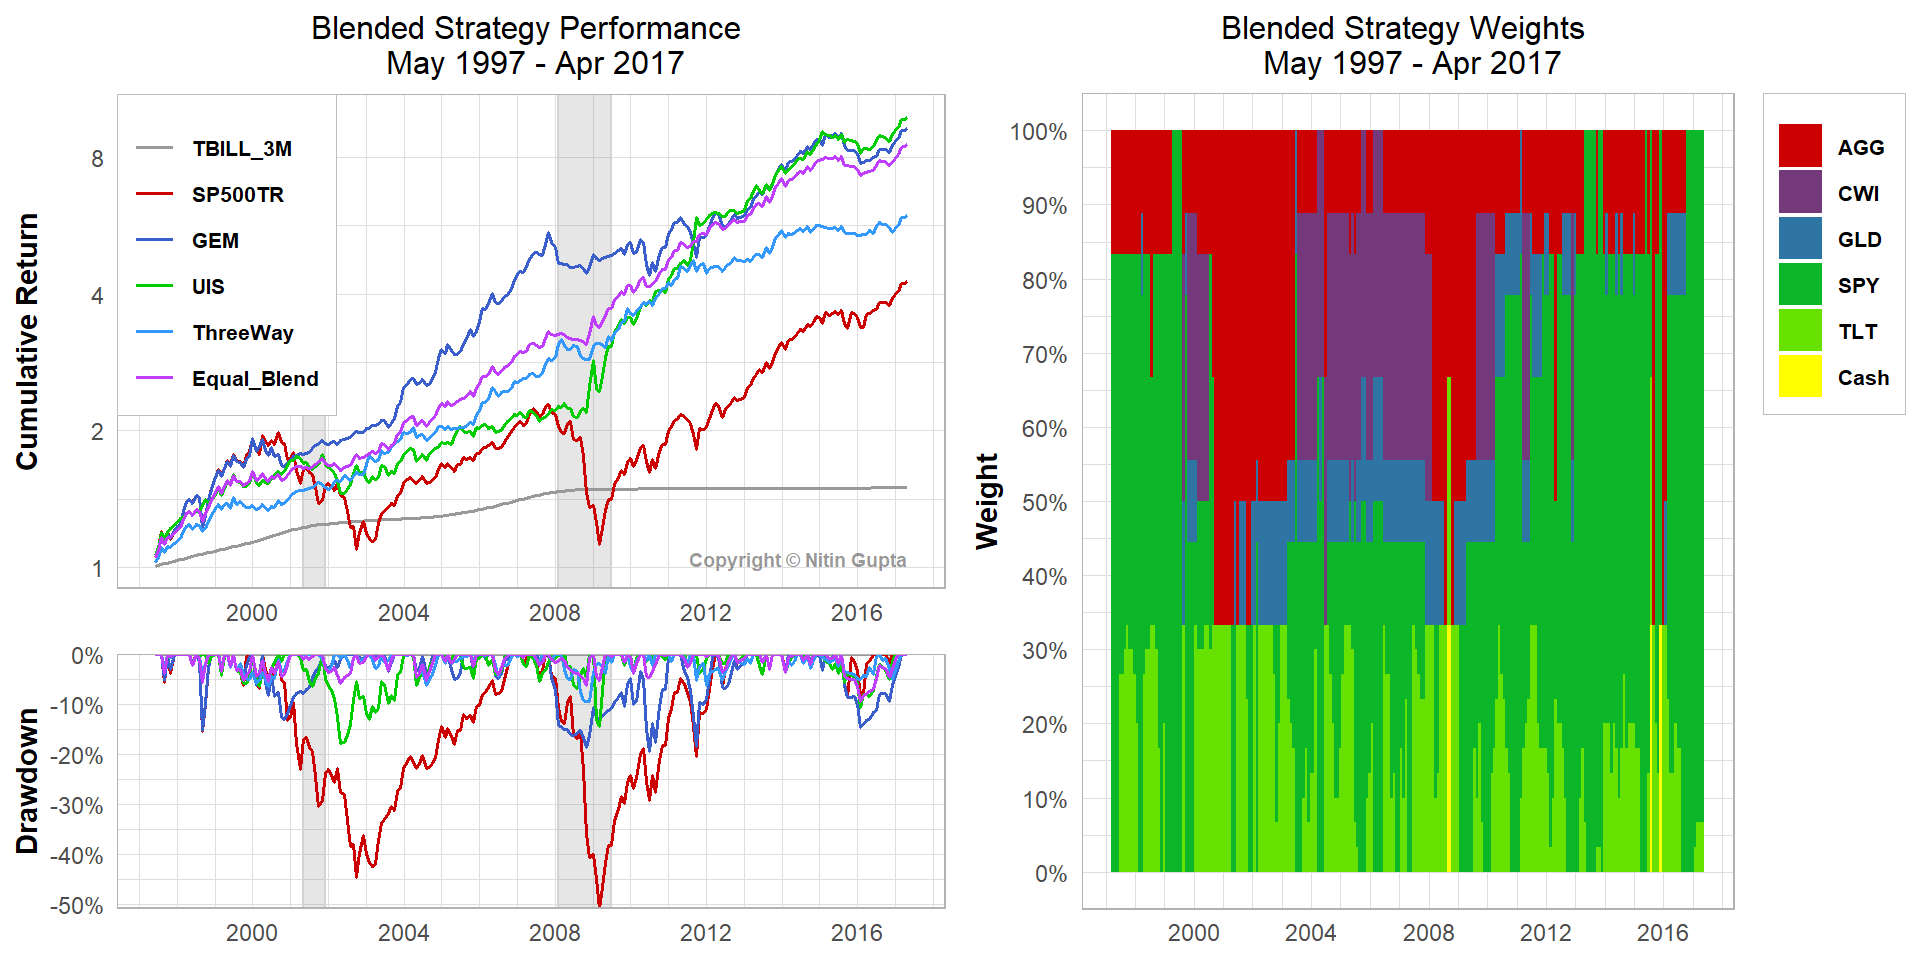
Combining GEM, UIS and Three-Way strategies on an equal weight basis, leads to even further reduction in portfolio volatility. At 8% it is closer to the lowest volatility of the three strategies. Even though the annualized return of the blended strategy is slightly lower than that of GEM, the risk adjusted return is ~ 40% higher.
| Table 7: Comparison of a blended strategy with 33.33% each of GEM, UIS & ThreeWay strategies | |||||
| SP500TR | GEM | UIS | ThreeWay | Equal_Blend | |
|---|---|---|---|---|---|
| ALL Years | |||||
| May 1997 - Apr 2017 Annualized Return | 7.52% | 11.79% | 12.10% | 9.34% | 11.32% |
| May 1997 - Apr 2017 Annualized Std Dev | 15.17% | 11.97% | 11.15% | 7.72% | 8.00% |
| May 1997 - Apr 2017 Annualized Sharpe (Rf=2.04%) | 0.35 | 0.80 | 0.88 | 0.93 | 1.14 |
| May 1997 - Apr 2017 Worst Drawdown | -50.95% | -19.32% | -17.81% | -9.39% | -9.46% |
| 10 Years | |||||
| May 2007 - Apr 2017 Annualized Return | 7.00% | 6.86% | 16.07% | 8.39% | 10.69% |
| May 2007 - Apr 2017 Annualized Std Dev | 15.25% | 11.83% | 12.56% | 8.13% | 7.91% |
| May 2007 - Apr 2017 Annualized Sharpe (Rf=0.52%) | 0.42 | 0.53 | 1.23 | 0.96 | 1.28 |
| May 2007 - Apr 2017 Worst Drawdown | -50.95% | -19.32% | -14.40% | -9.39% | -9.46% |
| 5 Years | |||||
| May 2012 - Apr 2017 Annualized Return | 13.36% | 9.05% | 10.24% | 5.29% | 8.25% |
| May 2012 - Apr 2017 Annualized Std Dev | 10.19% | 9.00% | 8.08% | 6.70% | 7.07% |
| May 2012 - Apr 2017 Annualized Sharpe (Rf=0.15%) | 1.29 | 0.99 | 1.25 | 0.77 | 1.14 |
| May 2012 - Apr 2017 Worst Drawdown | -8.36% | -14.52% | -10.50% | -5.04% | -9.46% |
| 1 Year | |||||
| May 2016 - Apr 2017 Annualized Return | 17.77% | 17.77% | 17.53% | 8.05% | 14.43% |
| May 2016 - Apr 2017 Annualized Std Dev | 6.05% | 6.05% | 6.34% | 7.32% | 5.52% |
| May 2016 - Apr 2017 Annualized Sharpe (Rf=0.44%) | 2.85 | 2.85 | 2.69 | 1.04 | 2.52 |
| May 2016 - Apr 2017 Worst Drawdown | -1.73% | -1.73% | -3.02% | -5.04% | -2.44% |
Here are the equity curves and the distribution of weights in the blended strategy:
Advantages
There are many advantages of this blended strategy:
- Works well in both bull and bear markets with low volatility
- Uses low cost, highly liquid ETFs
- With just 5 ETFs, it is very easy to implement and execute
- Low cost substitute ETFs and funds exist to employ it at scale
- Highly competitive with more complex strategies
Leveraged Blends
Given that the blended strategy exhibits very low volatility, the returns could be boosted by using leverage. To get a good sense of leveraged returns, I benchmark the margin rate at the prevailing 1-month USD LIBOR rate + 2%. This is well above the rates offered by brokerages catering to professional investors.
At the same level of volatility, the blended strategy would have produced over twice the returns of S&P 500 Total Returns Index, with much lower drawdowns.
| Table 8: Comparison of leveraged blends | |||||
| SP500TR | Blend_1X | Blend_1.3X | Blend_1.5X | Blend_2X | |
|---|---|---|---|---|---|
| ALL Years | |||||
| May 1997 - Apr 2017 Annualized Return | 7.52% | 11.32% | 13.30% | 14.60% | 17.80% |
| May 1997 - Apr 2017 Annualized Std Dev | 15.17% | 8.00% | 10.40% | 11.99% | 15.99% |
| May 1997 - Apr 2017 Annualized Sharpe (Rf=2.04%) | 0.35 | 1.14 | 1.06 | 1.03 | 0.97 |
| May 1997 - Apr 2017 Worst Drawdown | -50.95% | -9.46% | -12.48% | -14.46% | -19.30% |
| 10 Years | |||||
| May 2007 - Apr 2017 Annualized Return | 7.00% | 10.69% | 12.99% | 14.52% | 18.30% |
| May 2007 - Apr 2017 Annualized Std Dev | 15.25% | 7.91% | 10.29% | 11.88% | 15.86% |
| May 2007 - Apr 2017 Annualized Sharpe (Rf=0.52%) | 0.42 | 1.28 | 1.21 | 1.17 | 1.12 |
| May 2007 - Apr 2017 Worst Drawdown | -50.95% | -9.46% | -12.48% | -14.46% | -19.30% |
| 5 Years | |||||
| May 2012 - Apr 2017 Annualized Return | 13.36% | 8.25% | 9.98% | 11.13% | 13.93% |
| May 2012 - Apr 2017 Annualized Std Dev | 10.19% | 7.07% | 9.20% | 10.61% | 14.14% |
| May 2012 - Apr 2017 Annualized Sharpe (Rf=0.15%) | 1.29 | 1.14 | 1.07 | 1.03 | 0.97 |
| May 2012 - Apr 2017 Worst Drawdown | -8.36% | -9.46% | -12.48% | -14.46% | -19.30% |
| 1 Year | |||||
| May 2016 - Apr 2017 Annualized Return | 17.77% | 14.43% | 18.13% | 20.65% | 27.08% |
| May 2016 - Apr 2017 Annualized Std Dev | 6.05% | 5.52% | 7.18% | 8.28% | 11.04% |
| May 2016 - Apr 2017 Annualized Sharpe (Rf=0.44%) | 2.85 | 2.52 | 2.46 | 2.43 | 2.40 |
| May 2016 - Apr 2017 Worst Drawdown | -1.73% | -2.44% | -3.35% | -3.96% | -5.47% |
Further Ideas
Scaling: Create weekly tranches, check signals and rebalance weekly instead of monthly. This way only 25% of the portfolio is exposed to whipsaw risk. Also, the trade sizes are reduced at any given point. I wrote about these ideas in a prior post.
Risk Management: From the weights plot of the blended strategy, it is evident that during some periods, 100% of the portfolio risk is concentrated in SPY. A prudent risk management strategy would limit the concentration on any single asset in a portfolio. So sudden unfavorable movements have less of an impact.
Add more uncorrelated strategies: Instead of being all-in on momentum only, value strategies could be added to the mix, which exhibit low correlation to momentum strategies.
Alternative Implementation: Implement this strategy using futures products which provide greater control over margins to scale up or down.
Conclusion
Investors are either totally passive or too fixated on finding a single unicorn strategy that’ll work well during both good and bad times. The key is to put together a team of sufficiently uncorrelated strategies that work well together to build a robust portfolio.
Disclaimer
All content displayed here is for informational purposes only and is not guaranteed to be accurate, complete or up-to-date. The returns presented are hypothetical and do not represent returns attained by any investor. The content and commentary are intended to provide the views and observations of the author only, and are subject to change at any time without prior notice, and do NOT represent those of past, present or future employers. Nothing herein should be considered investment advice or recommendation to buy, sell or hold any securities.