Luck in Rebalance Timing
An important and often overlooked topic was raised by Corey Hoffstein at NewFound Research. Here are his first couple of tweets on that topic:
Indeed, this is about rebalance timing and how little attention it gets. Within the construct of a systematic strategy, this is a part of the Execution Model.
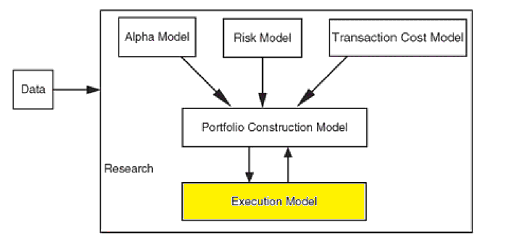
The Black Box Revealed
Courtesy: Inside the Black Box - The Simple Truth about Quantitative Trading by Rishi Narang
Unless it’s an intraday trading model, when it comes to portfolio rebalancing, a common convention is to rebalance at the beginning of a new month. Perhaps, these are some of the reasons behind this convention:
- In published literature, a monthly period is commonly used for portfolio rebalancing. Hence it has become a sort of common convention to follow.
- Most of the researchers are adept in using Excel, but less so in programming languages. While doing a backtest in Excel, it is easier to manipulate monthly data and do performance analysis, as opposed doing it with daily data.
- In some cases, investible products for some asset classes have not existed beyond a couple of decades at best. So longer backtests are often done using theoretical indices which are often available only in monthly format. Hence it forces the choice of a monthly rebalancing cycle. This implies rebalancing at the beginning of a new month.
But should this be accepted just on the basis of a common convention? If a monthly rebalancing cycle is adopted, does it matter which day of the month is chosen for rebalance? Are there any major differences between portfolios rebalanced on the first business day of a month, as opposed to other days? Are these differences just completely random in nature?
These are some of the questions that need to be answered.
Strategy
To answer these questions, I used one of the most basic market timing strategies:
Go long S&P500 when it trades above its 200 days simple moving average (SMA), otherwise exit and invest in T-Bills.
There is nothing magical about using a 200 days SMA. Other periods in the same ballpark work just as well, as shown by Meb Faber in his QTAA paper. I used this simple strategy to illustrate the effect of rebalance timing on portfolio performance.
I put together a historical daily total returns dataset of SPDR S&P 500 ETF (SPY), spliced together with historical daily total returns data of Vanguard 500 Index fund (VFINX), prior to Feb. 1993. This data was sourced from Yahoo! Finance, prior to their API fiasco earlier this month. Both of these products closely track the S&P500 Total Returns Index. This provides 37+ years of historical daily total returns data going back to the beginning of 1980.
Methodology
To test the effect of rebalance timing, I constructed 21 portfolio series, assuming 21 business days in a month. The first portfolio series is rebalanced on the first business day of a month, using the trading signal as of the end of the previous month. In short, signal @ t, rebalance @ t+1. If there are fewer than 21 business days in a month, say for instance 19 days, then portfolio series 20 and 21 are rebalanced on the first business day of the next month. A transaction cost of 10 bps is applied on each trade.
Here are the results:
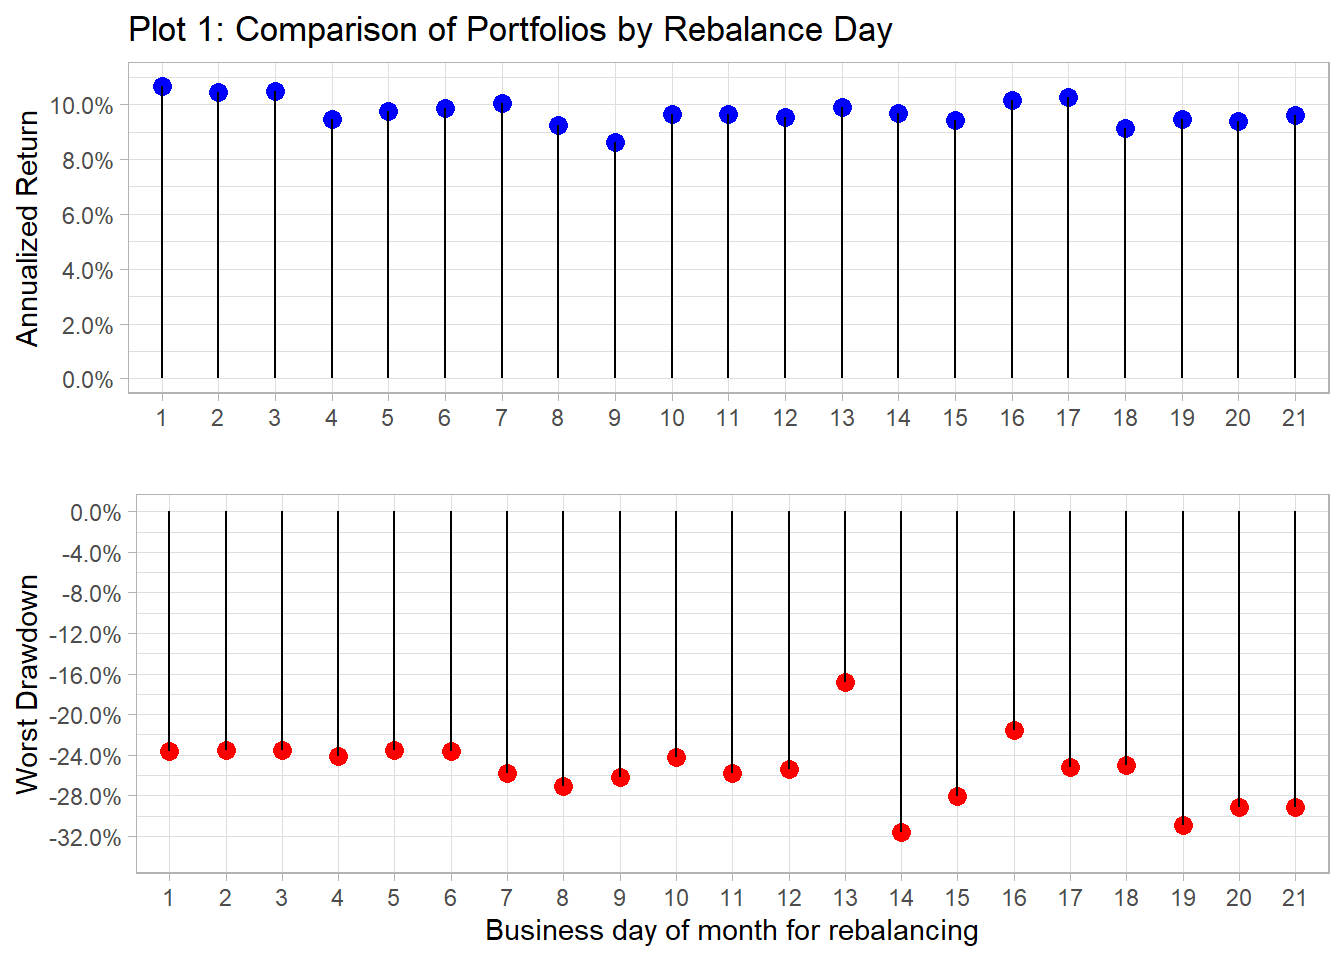
The impact of luck could be observed in drawdowns as well as returns. The worst drawdown of series 13 is just a little more than half of series 14. Nevertheless, their annualized returns are almost the same. In all the cases, except series 13, the worst drawdown happened after the crash of 1987. Ironically, series 13 is the lucky one here ;). As Corey mentioned in his tweets, for an investment manager this is a difference between getting hired and fired.
At the moment, series 1, gives the best return. As we progress to series 9, the returns decrease quite significantly. There is a difference of over 2% in their annualized returns. Here are their performance summaries:
| Table 1: Best and worst rebalance series | ||
| Best | Worst | |
|---|---|---|
| ALL Years | ||
| Jan 1981 - Apr 2017 Annualized Return | 10.68% | 8.63% |
| Jan 1981 - Apr 2017 Annualized Std Dev | 11.09% | 11.87% |
| Jan 1981 - Apr 2017 Annualized Sharpe (Rf=4.22%) | 0.55 | 0.35 |
| Jan 1981 - Apr 2017 Worst Drawdown | -23.59% | -26.20% |
Let’s take a look at how the best (blue) and the worst (red) series have fared relative to the other 19 series in the entire historical period:
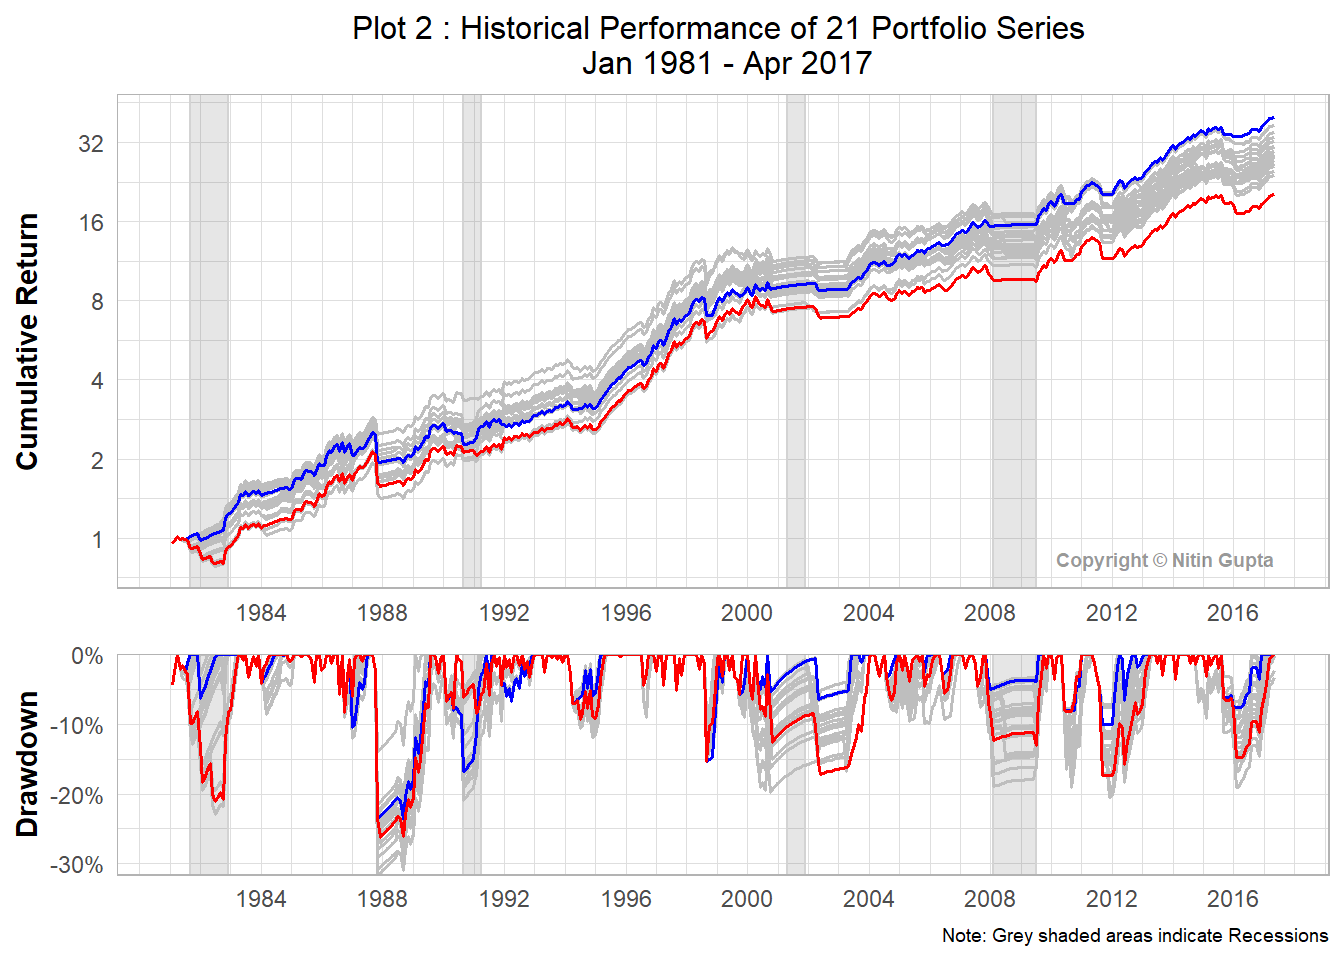
So, turns out the current best performed worse than the median for most of the historical period. But since 2003, it really took off and has managed to avoid many whipsaws that appear to have affected other series. But will it continue to do better? The impact of luck is quite obvious here. Quite surprisingly, the worst series has been at or near the worst throughout the historical period. Perhaps a longer backtest or one with a different investment strategy would be useful to investigate this further.
Mitigating the impact of luck
So how could the impact of luck be mitigated without resorting to more frequent rebalancing, and thus incurring higher portfolio turnover costs?
Here are a couple of ideas:
Create four weekly portfolio series staggered by a week, where each series is rebalanced at the interval of 4 weeks. This way, at any given time, only ~ 25% of the capital is exposed to whipsaw risk. But a practical challenge here is to ensure that each series remains balanced relative to others. Say for instance, no single series should have a weight greater than a third of the entire portfolio. This could be managed by leveraging / deleveraging at rebalance time.
Stick with rebalancing at the beginning of a new month (t+1). But instead of taking the signal at the last day of the prior month (t), take the median (or mean) of the daily signals in the prior month. This is similar to Corey’s idea of signal smoothing with 21 days SMA of signals.
Let’s see how these methods compare to the best and worst portfolios:
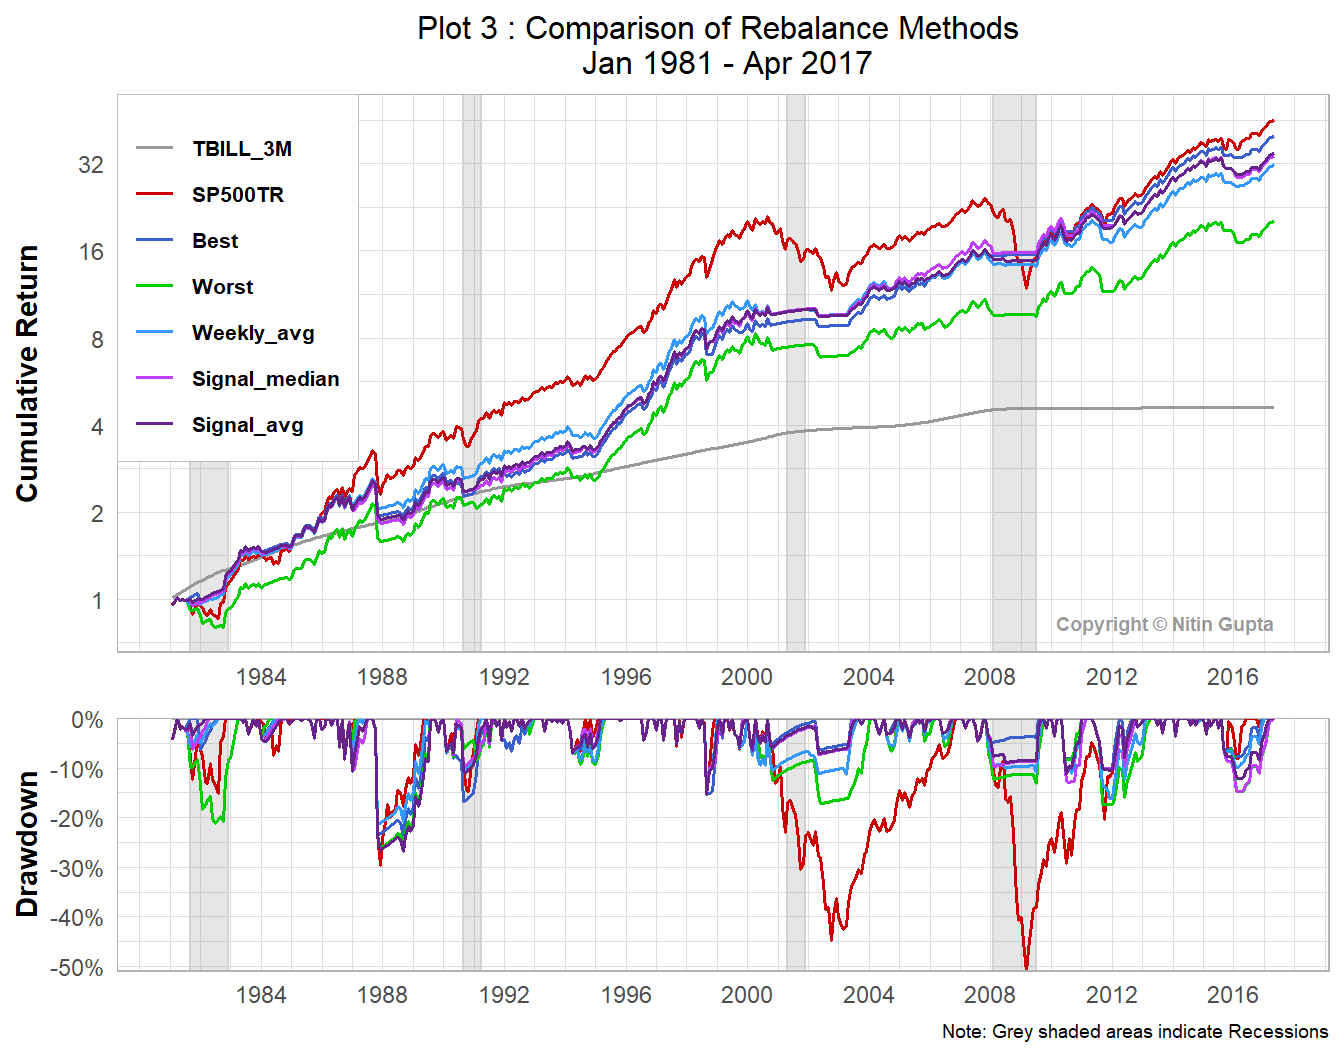
The three methods with overlapping portfolios and signal smoothing are denoted by Weekly_avg, Signal_median, Signal_avg. We can observe that all of these methods have similar performance profiles in the historical period, with minor differences in shorter time periods. They perform much better than the Worst portfolio series, in all time periods. And during most of the historical period, they have even performed better than the current Best series.
| Table 2: Comparison of rebalance methods | ||||||
| SP500TR | Best | Worst | Weekly_avg | Signal_median | Signal_avg | |
|---|---|---|---|---|---|---|
| ALL Years | ||||||
| Jan 1981 - Apr 2017 Annualized Return | 11.07% | 10.68% | 8.63% | 9.99% | 10.19% | 10.26% |
| Jan 1981 - Apr 2017 Annualized Std Dev | 14.85% | 11.09% | 11.87% | 11.01% | 11.45% | 11.11% |
| Jan 1981 - Apr 2017 Annualized Sharpe (Rf=4.22%) | 0.44 | 0.55 | 0.35 | 0.50 | 0.49 | 0.51 |
| Jan 1981 - Apr 2017 Worst Drawdown | -50.95% | -23.59% | -26.20% | -21.42% | -26.87% | -26.87% |
| 20 Years | ||||||
| May 1997 - Apr 2017 Annualized Return | 7.52% | 10.18% | 7.58% | 8.15% | 9.07% | 9.17% |
| May 1997 - Apr 2017 Annualized Std Dev | 15.17% | 10.02% | 10.98% | 10.09% | 10.38% | 9.98% |
| May 1997 - Apr 2017 Annualized Sharpe (Rf=2.04%) | 0.35 | 0.80 | 0.49 | 0.59 | 0.66 | 0.70 |
| May 1997 - Apr 2017 Worst Drawdown | -50.95% | -15.28% | -17.37% | -16.18% | -15.28% | -15.28% |
| 10 Years | ||||||
| May 2007 - Apr 2017 Annualized Return | 7.00% | 10.02% | 6.93% | 7.65% | 7.50% | 8.40% |
| May 2007 - Apr 2017 Annualized Std Dev | 15.25% | 9.18% | 10.62% | 9.86% | 9.74% | 9.41% |
| May 2007 - Apr 2017 Annualized Sharpe (Rf=0.52%) | 0.42 | 1.03 | 0.60 | 0.72 | 0.71 | 0.83 |
| May 2007 - Apr 2017 Worst Drawdown | -50.95% | -10.06% | -17.37% | -16.18% | -14.77% | -12.00% |
| 5 Years | ||||||
| May 2012 - Apr 2017 Annualized Return | 13.36% | 11.91% | 10.08% | 10.84% | 10.12% | 10.58% |
| May 2012 - Apr 2017 Annualized Std Dev | 10.19% | 8.77% | 9.55% | 8.82% | 9.29% | 8.98% |
| May 2012 - Apr 2017 Annualized Sharpe (Rf=0.15%) | 1.29 | 1.34 | 1.04 | 1.21 | 1.07 | 1.16 |
| May 2012 - Apr 2017 Worst Drawdown | -8.36% | -7.64% | -14.78% | -9.88% | -14.77% | -12.00% |
As we can see, relatively simple solutions work well to mitigate the impact of luck in rebalance timing.
Disclaimer
All content displayed here is for informational purposes only and is not guaranteed to be accurate, complete or up-to-date. Nothing herein should be considered investment advice or recommendation to buy, sell or hold any securities.